

Core concepts
What is tracing?
LLM applications are non-deterministic and usually multi-step: a single user request might embed a query, search a vector database, call a model, then call a tool. When something is slow, expensive, or wrong, you need to see every step of that one request, not just the final answer.
A trace is that record. It captures each step, how long it took, what it cost, what went in, and what came out. Tracing is the act of producing those records as your app runs.
Everything in Respan is built from one primitive, the span, plus a few ways of grouping spans together:
All of these read from the same underlying span data. The difference is only how they organize it.
For evaluation concepts (scores, evaluators, experiments), see Evals concepts.
Spans
A span is a single recorded operation. Think of it as one line item on an itemized receipt for a request. When you send an LLM request through Respan, whether via the gateway, the API, or a tracing SDK, Respan creates a span.
Every span uses a universal input / output design. The system automatically serializes your data regardless of format, extracts type-specific fields (tool calls, thinking blocks, etc.), calculates metrics when possible, and associates the span with traces, threads, and customers based on the identifiers you provide.
What’s in a span
Every span has a log_type that determines its input/output format. The most common is chat (messages in, assistant message out), but Respan also supports embedding, speech, transcription, tool, agent, workflow, and more. See Span types & multimodal for the full list.
For the complete field reference, see Span attributes.
Traces
A trace is a group of spans that belong to the same request. Spans within a trace form a tree using parent-child relationships, so you can see exactly how the request flowed through your agents, tasks, and tools, much like a call stack.
Take a simple question-answering app. A user asks “What’s our refund policy?” and your app embeds the question, searches your docs, then asks a model to write the answer. That single request becomes one trace with four spans:
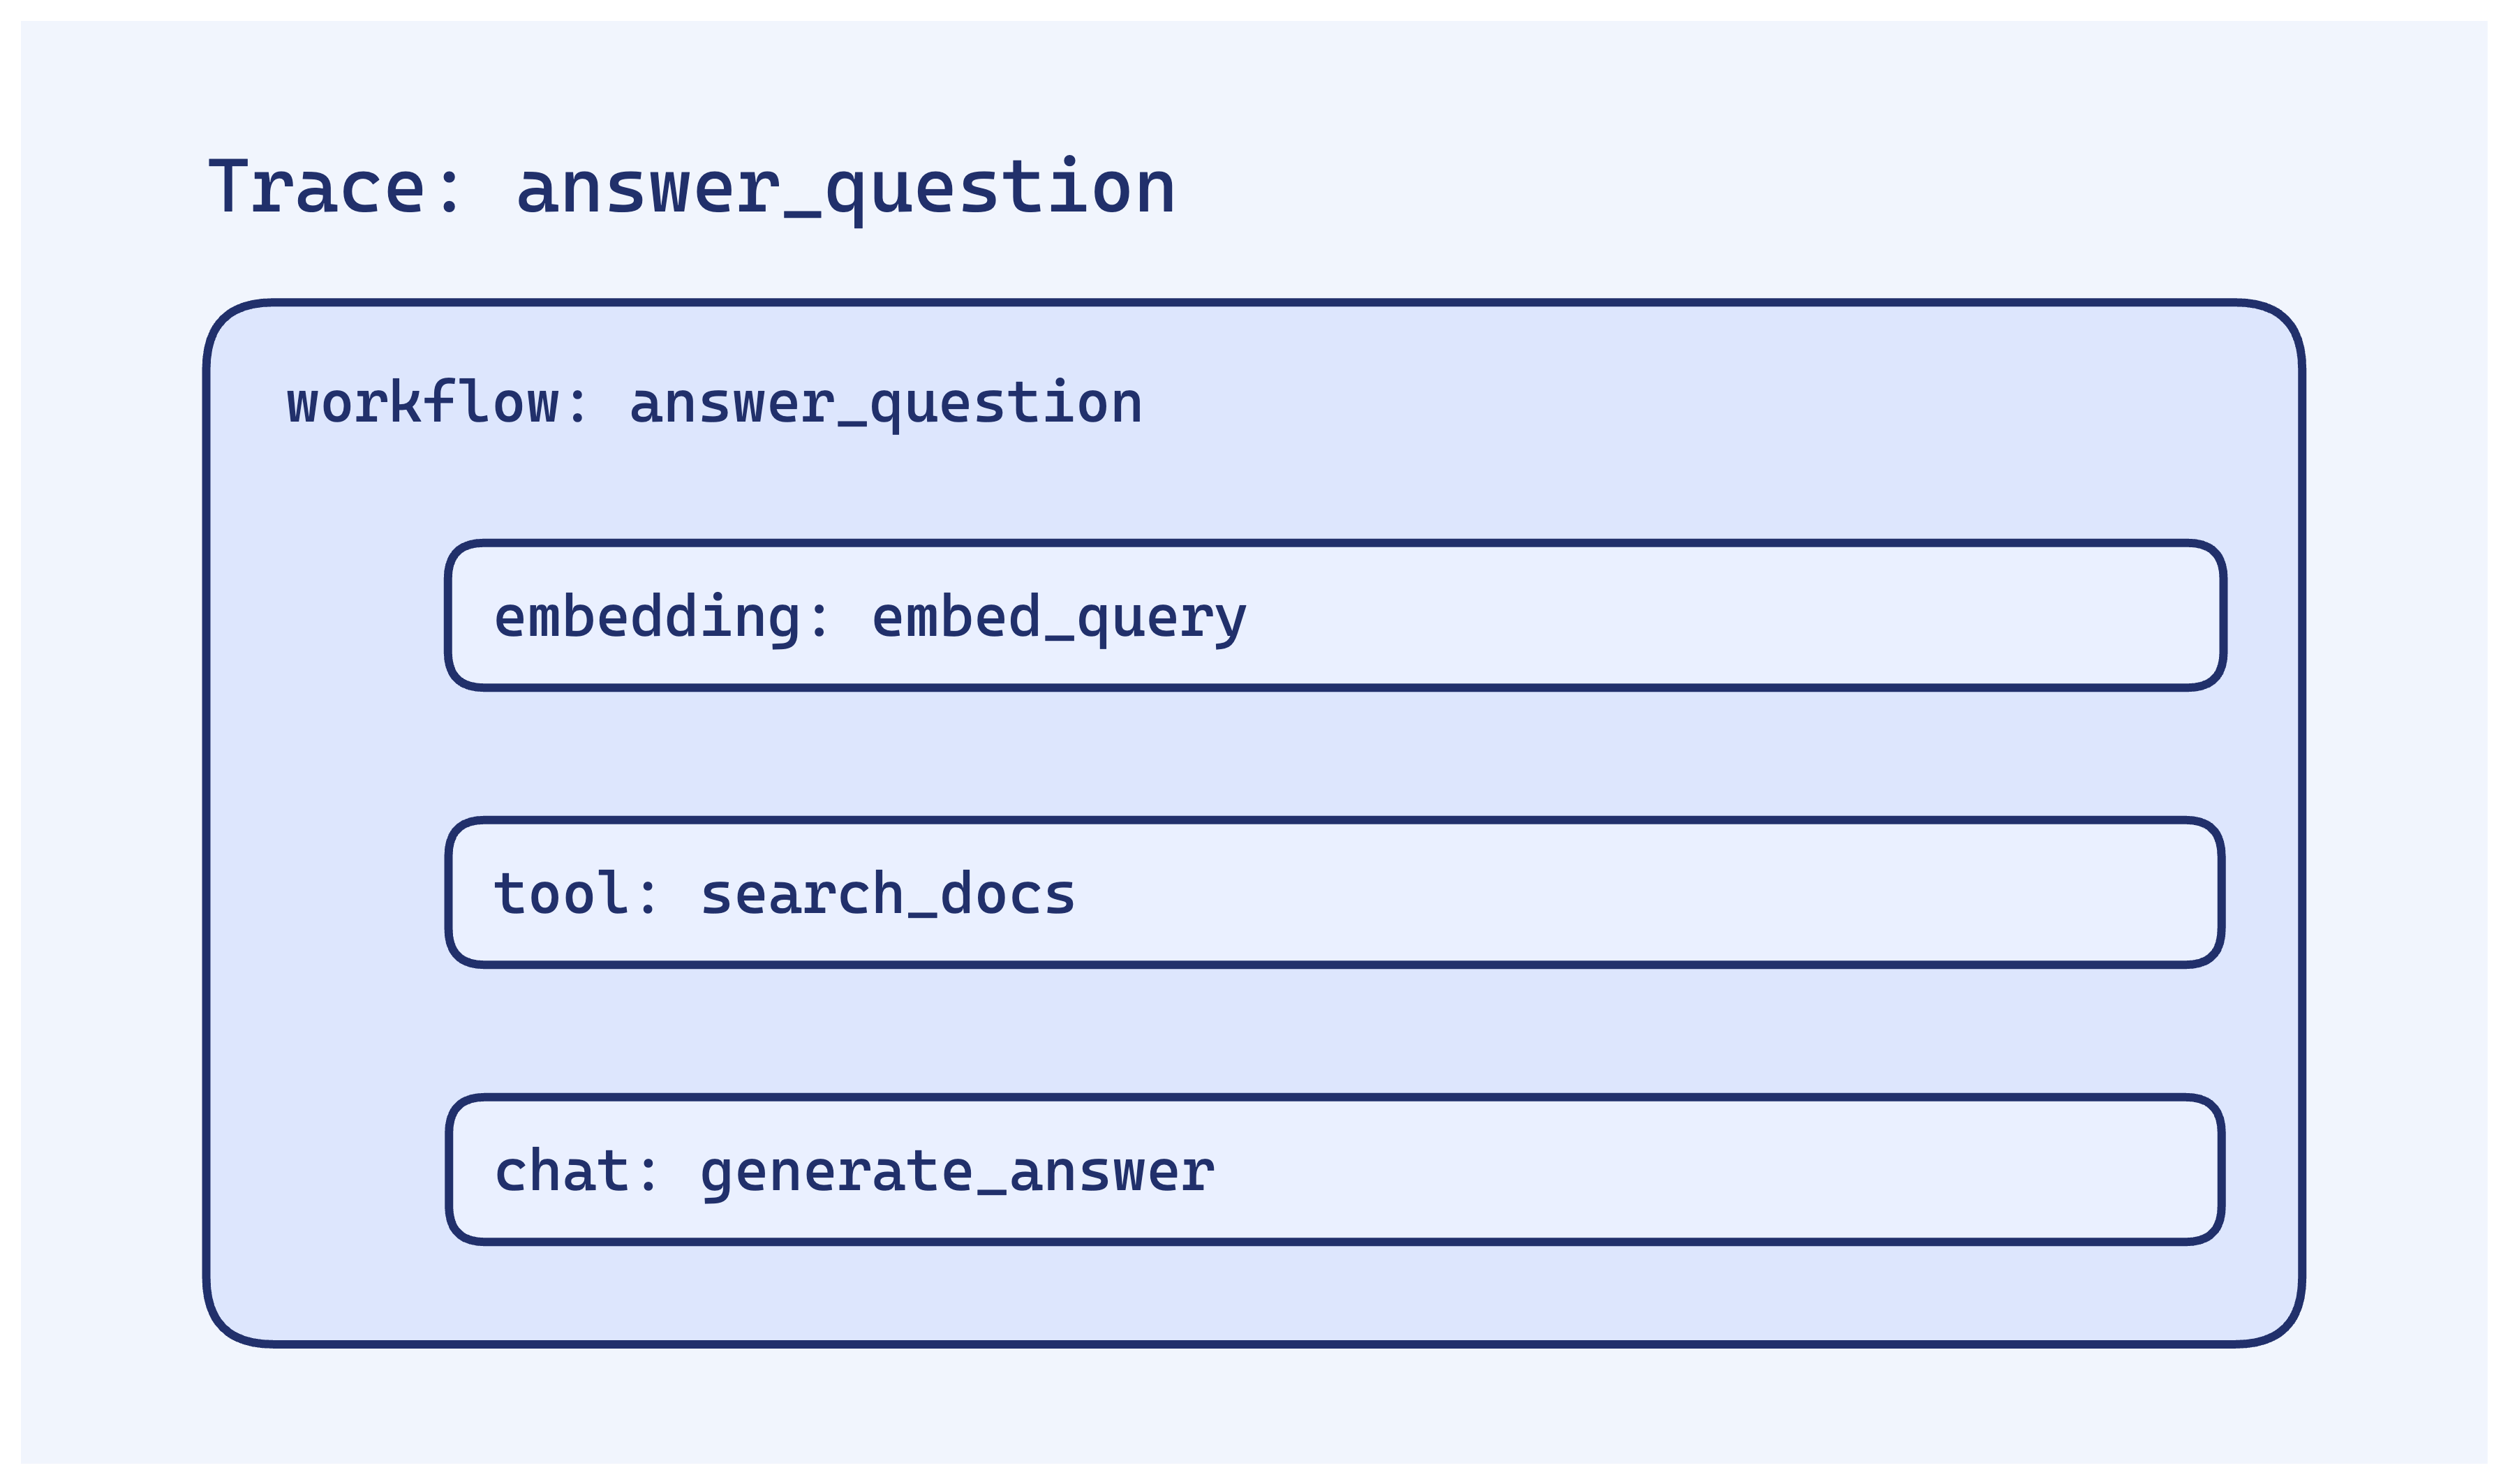
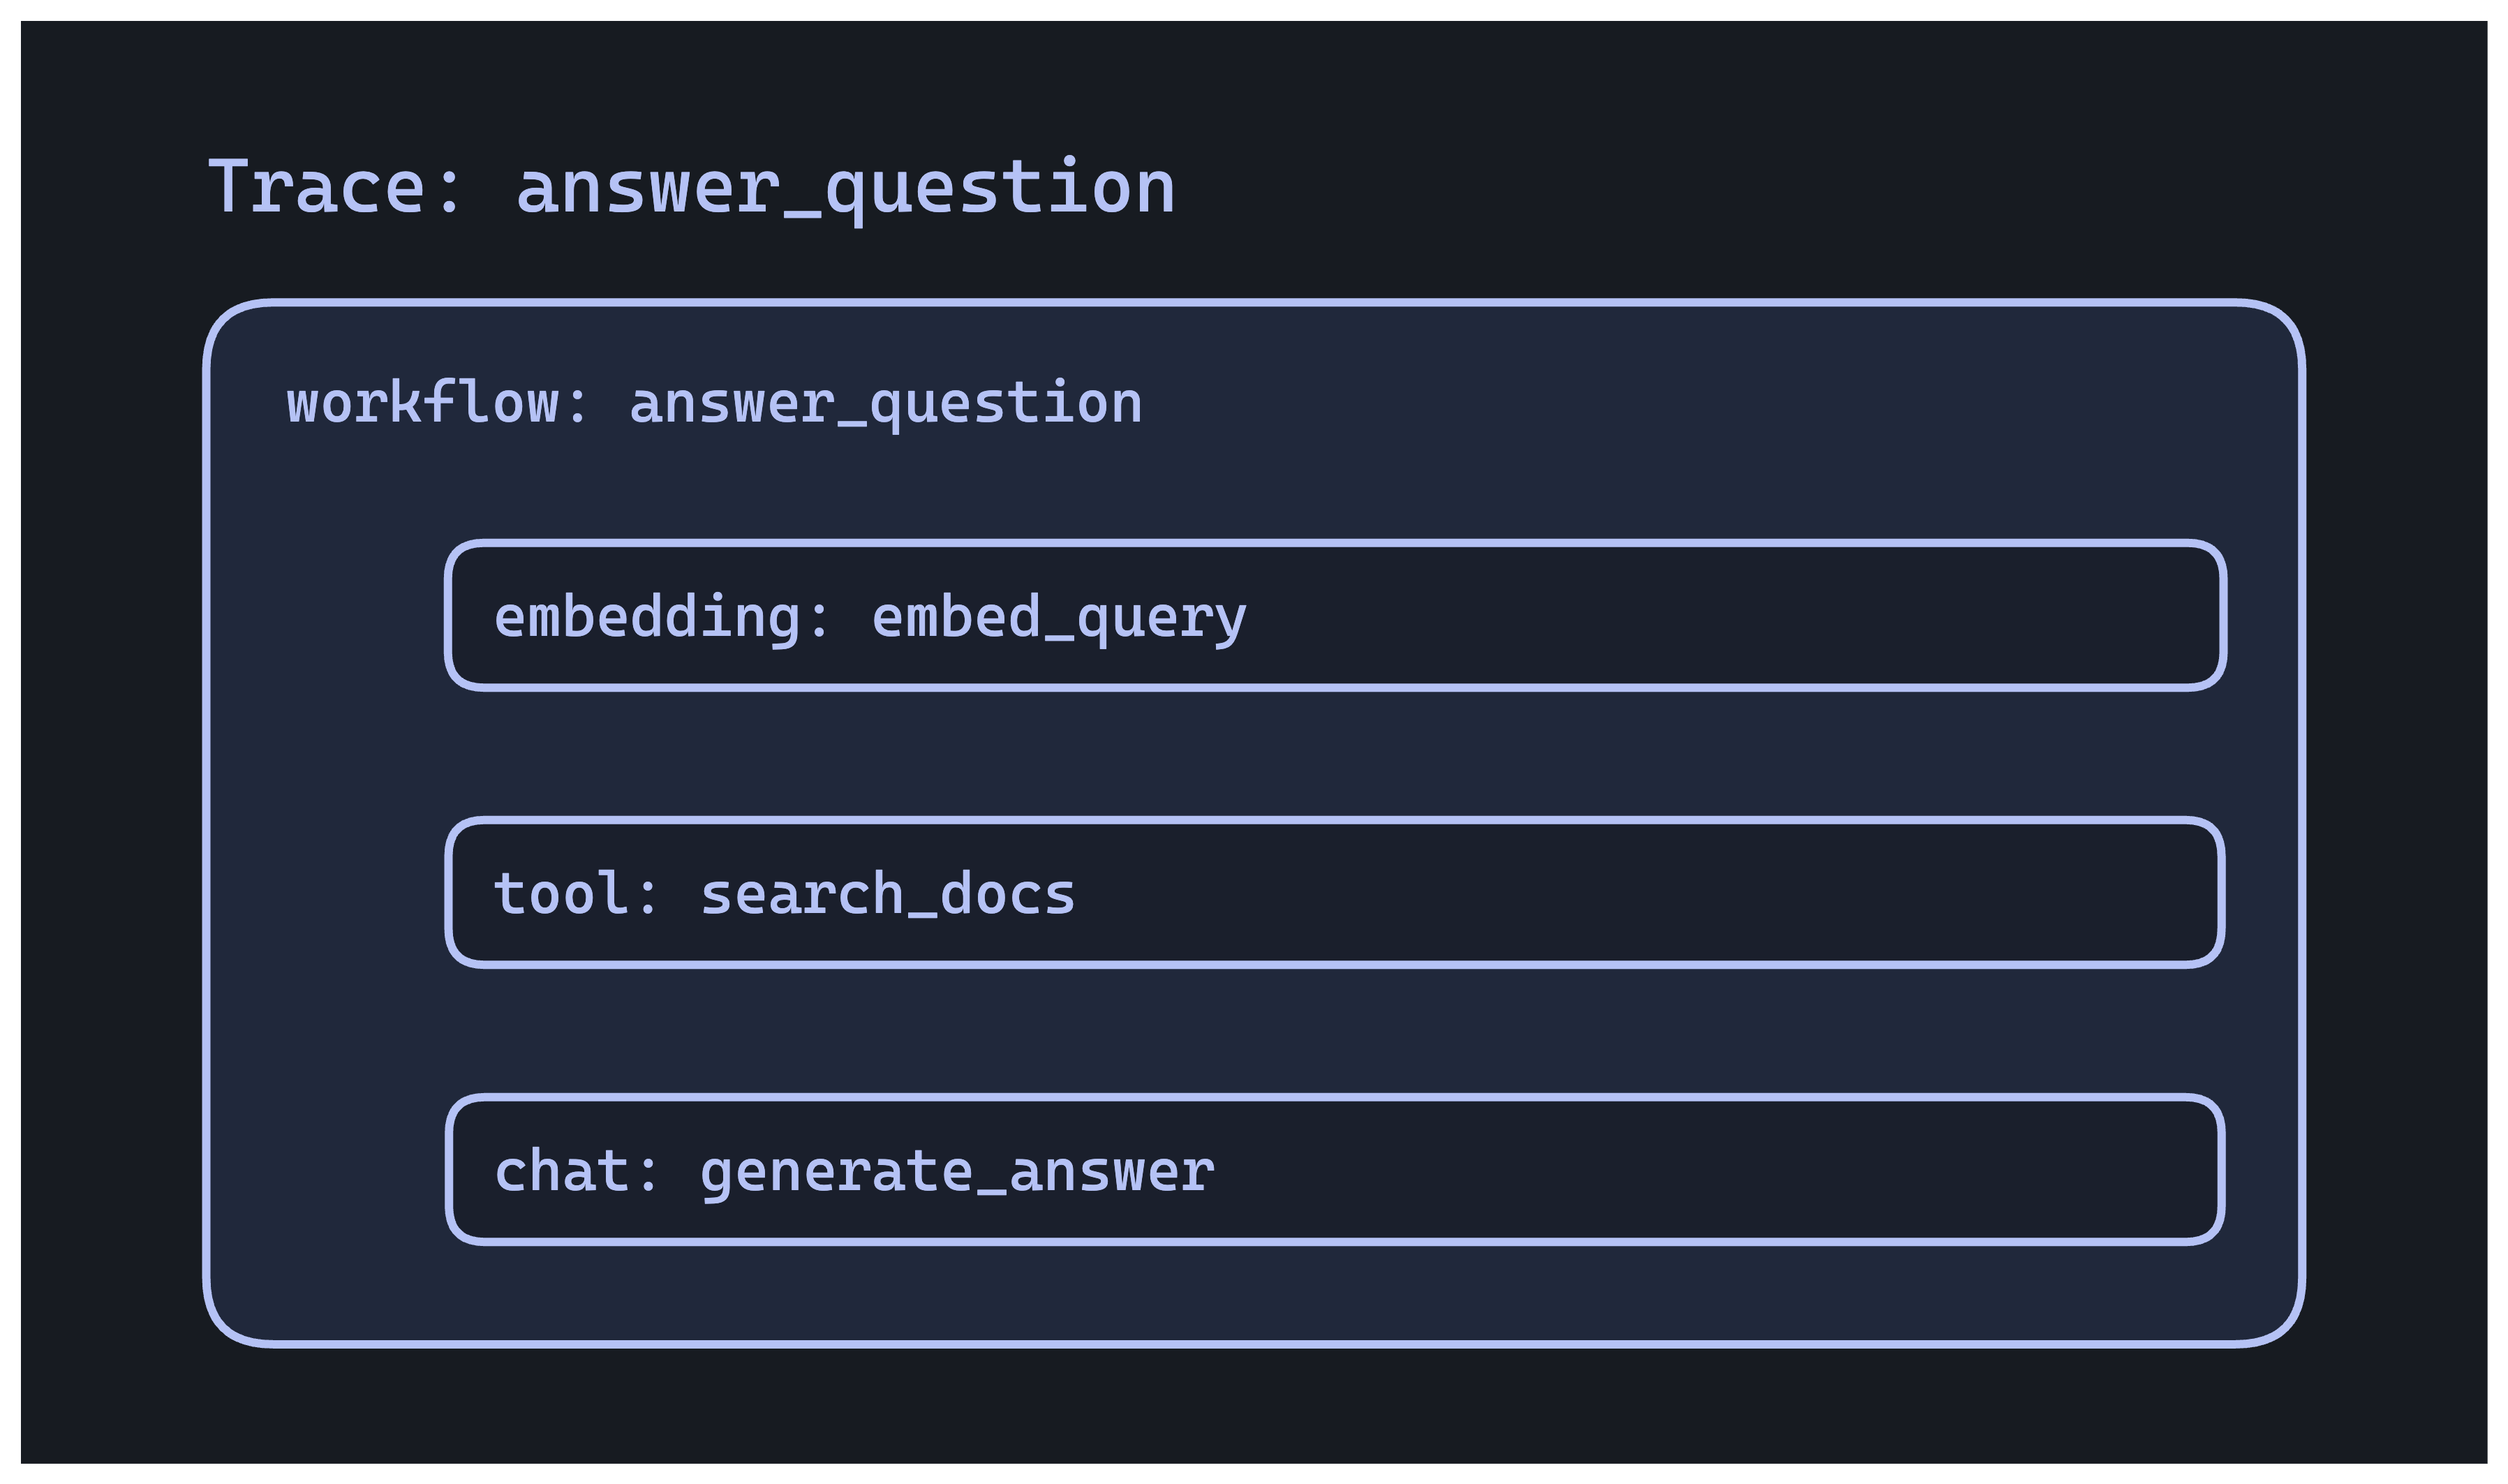
The root span is the whole request; the three child spans are the steps it took. If the answer was wrong, you can open the trace and see whether retrieval returned the right docs before blaming the model.
Key trace fields
trace_unique_id: groups all spans in the same requestspan_unique_id: individual span identifierspan_parent_id: creates the parent-child hierarchy (omit it for the root span)span_name: descriptive name for the operation (e.g."search_docs")span_workflow_name: the nearest workflow this span belongs to
Multi-trace grouping
Longer-running work (a multi-session agent, a job that resumes later) can span multiple traces. Use trace_group_identifier to tie them together:
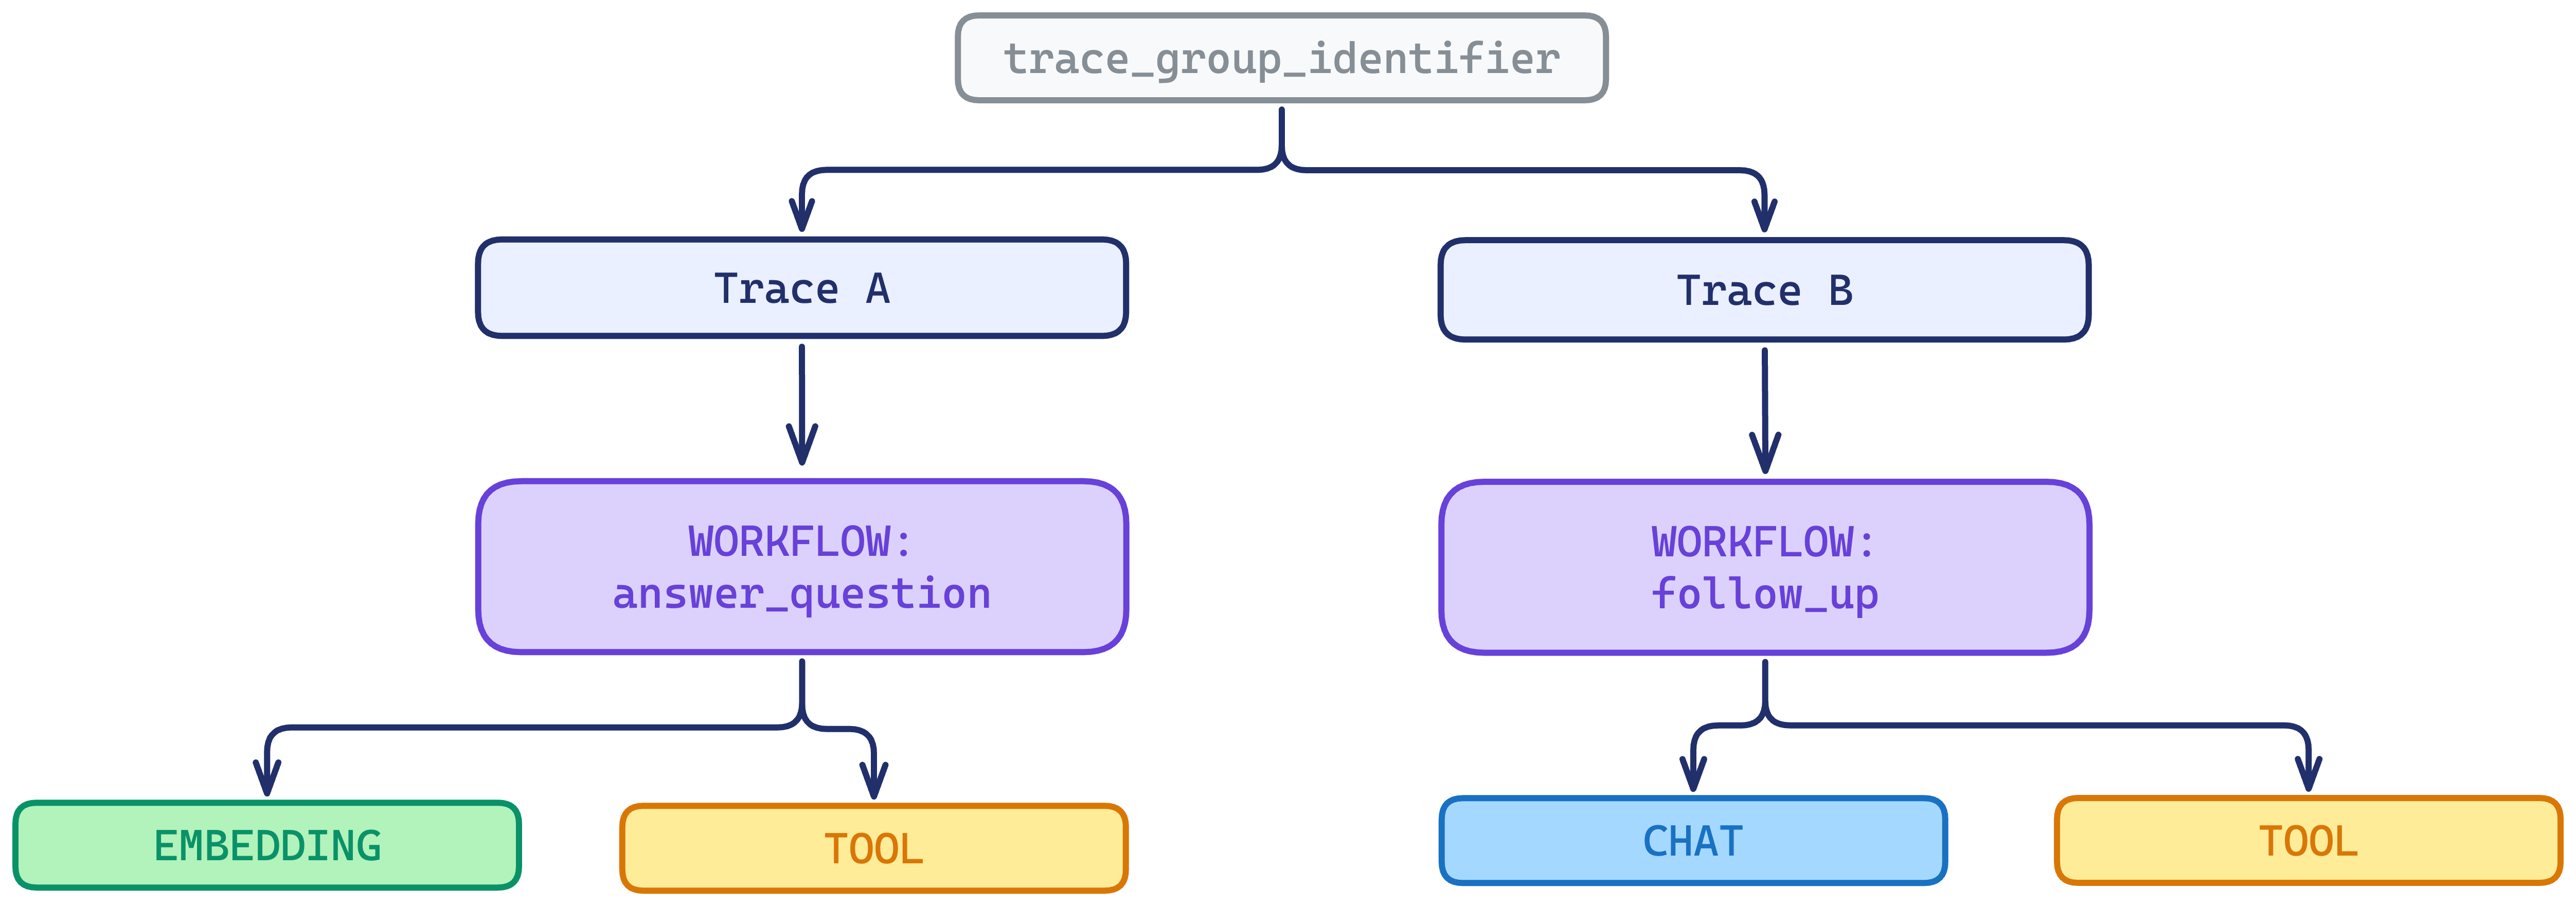
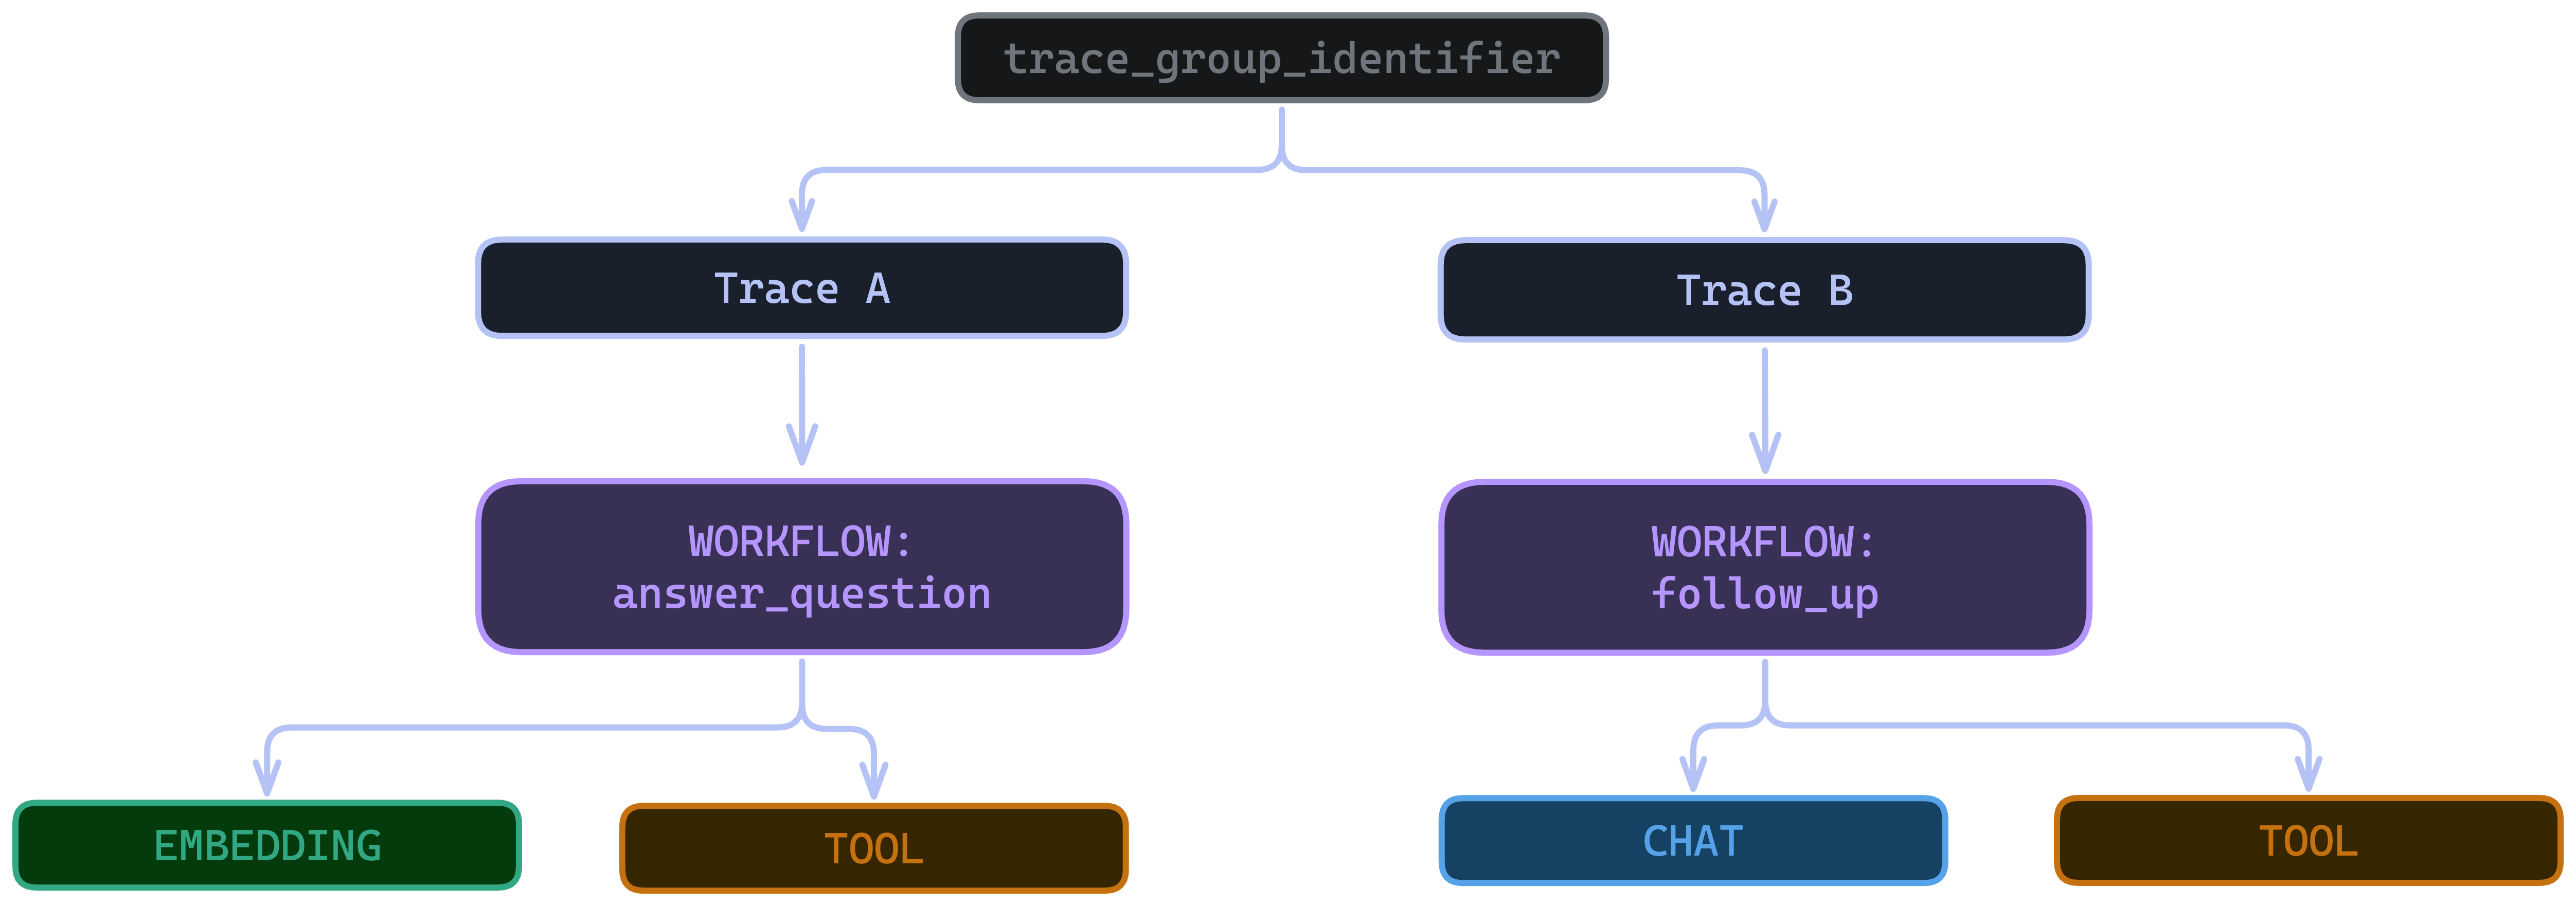
Spans can also be grouped into a thread (a time-ordered conversation view, ideal for chat apps) by giving them the same thread_identifier. A single span can belong to both a trace and a thread. See Metadata & tags to instrument the identifier, then follow a session with Threads in the platform.
How tracing works
You don’t write spans by hand. Instead, you add instrumentation: a small amount of setup that watches your app and emits spans automatically as it runs.
From your app to Respan
Respan is built on OpenTelemetry (OTEL), the open standard for tracing. A span travels from your code, through the OpenTelemetry layer, to the Respan dashboard:


Because the format is standard OTEL, anything that already speaks OTLP can send data to Respan with no custom integration.
Instrumentation approaches
How you set up instrumentation determines the shape of your traces: whether they come out as flat, individual spans or as a nested tree.
The same operations produce different trace shapes depending on how you instrument. Auto-instrumentation (Respan()) records each LLM call as its own standalone span, so they land as separate flat traces. Explicit instrumentation (Respan(instrumentations=[…])) and decorators also capture the steps around those calls, nesting them under a shared root span:
![Side-by-side comparison. Left, Auto-instrumentation with Respan(): three separate flat traces, each holding one span — embed_query, search_docs, and generate_answer. Right, Explicit instrumentation with Respan(instrumentations=[...]): a single trace with a workflow root span (answer_question) and three nested child spans — embed_query, search_docs, and generate_answer.](https://cdn.respan.ai/respan_docs/documentation/tracing/tracing-instrum-light.png)
![Side-by-side comparison. Left, Auto-instrumentation with Respan(): three separate flat traces, each holding one span — embed_query, search_docs, and generate_answer. Right, Explicit instrumentation with Respan(instrumentations=[...]): a single trace with a workflow root span (answer_question) and three nested child spans — embed_query, search_docs, and generate_answer.](https://cdn.respan.ai/respan_docs/documentation/tracing/tracing-instrum-dark.png)
When you pass instrumentations=[…], auto-instrumentation is turned off by default to avoid duplicate spans. Pass is_auto_instrument=True (Python) to run both.
For the full SDK list, framework instrumentors, and setup code, see Set up the SDK. To add your own nesting with decorators, see Decorators.
Next steps
- Set up the SDK: instrument your app and start sending traces
- Decorators: group your own functions into nested traces
- Span attributes: the complete field reference