

SQL editor
Open Observability → SQL editor
to query your recorded spans with read-only ClickHouse SQL. Use the logs table
to compare models, investigate cost and latency, or answer questions beyond the
standard span filters.
Run your first query
- Click New query.
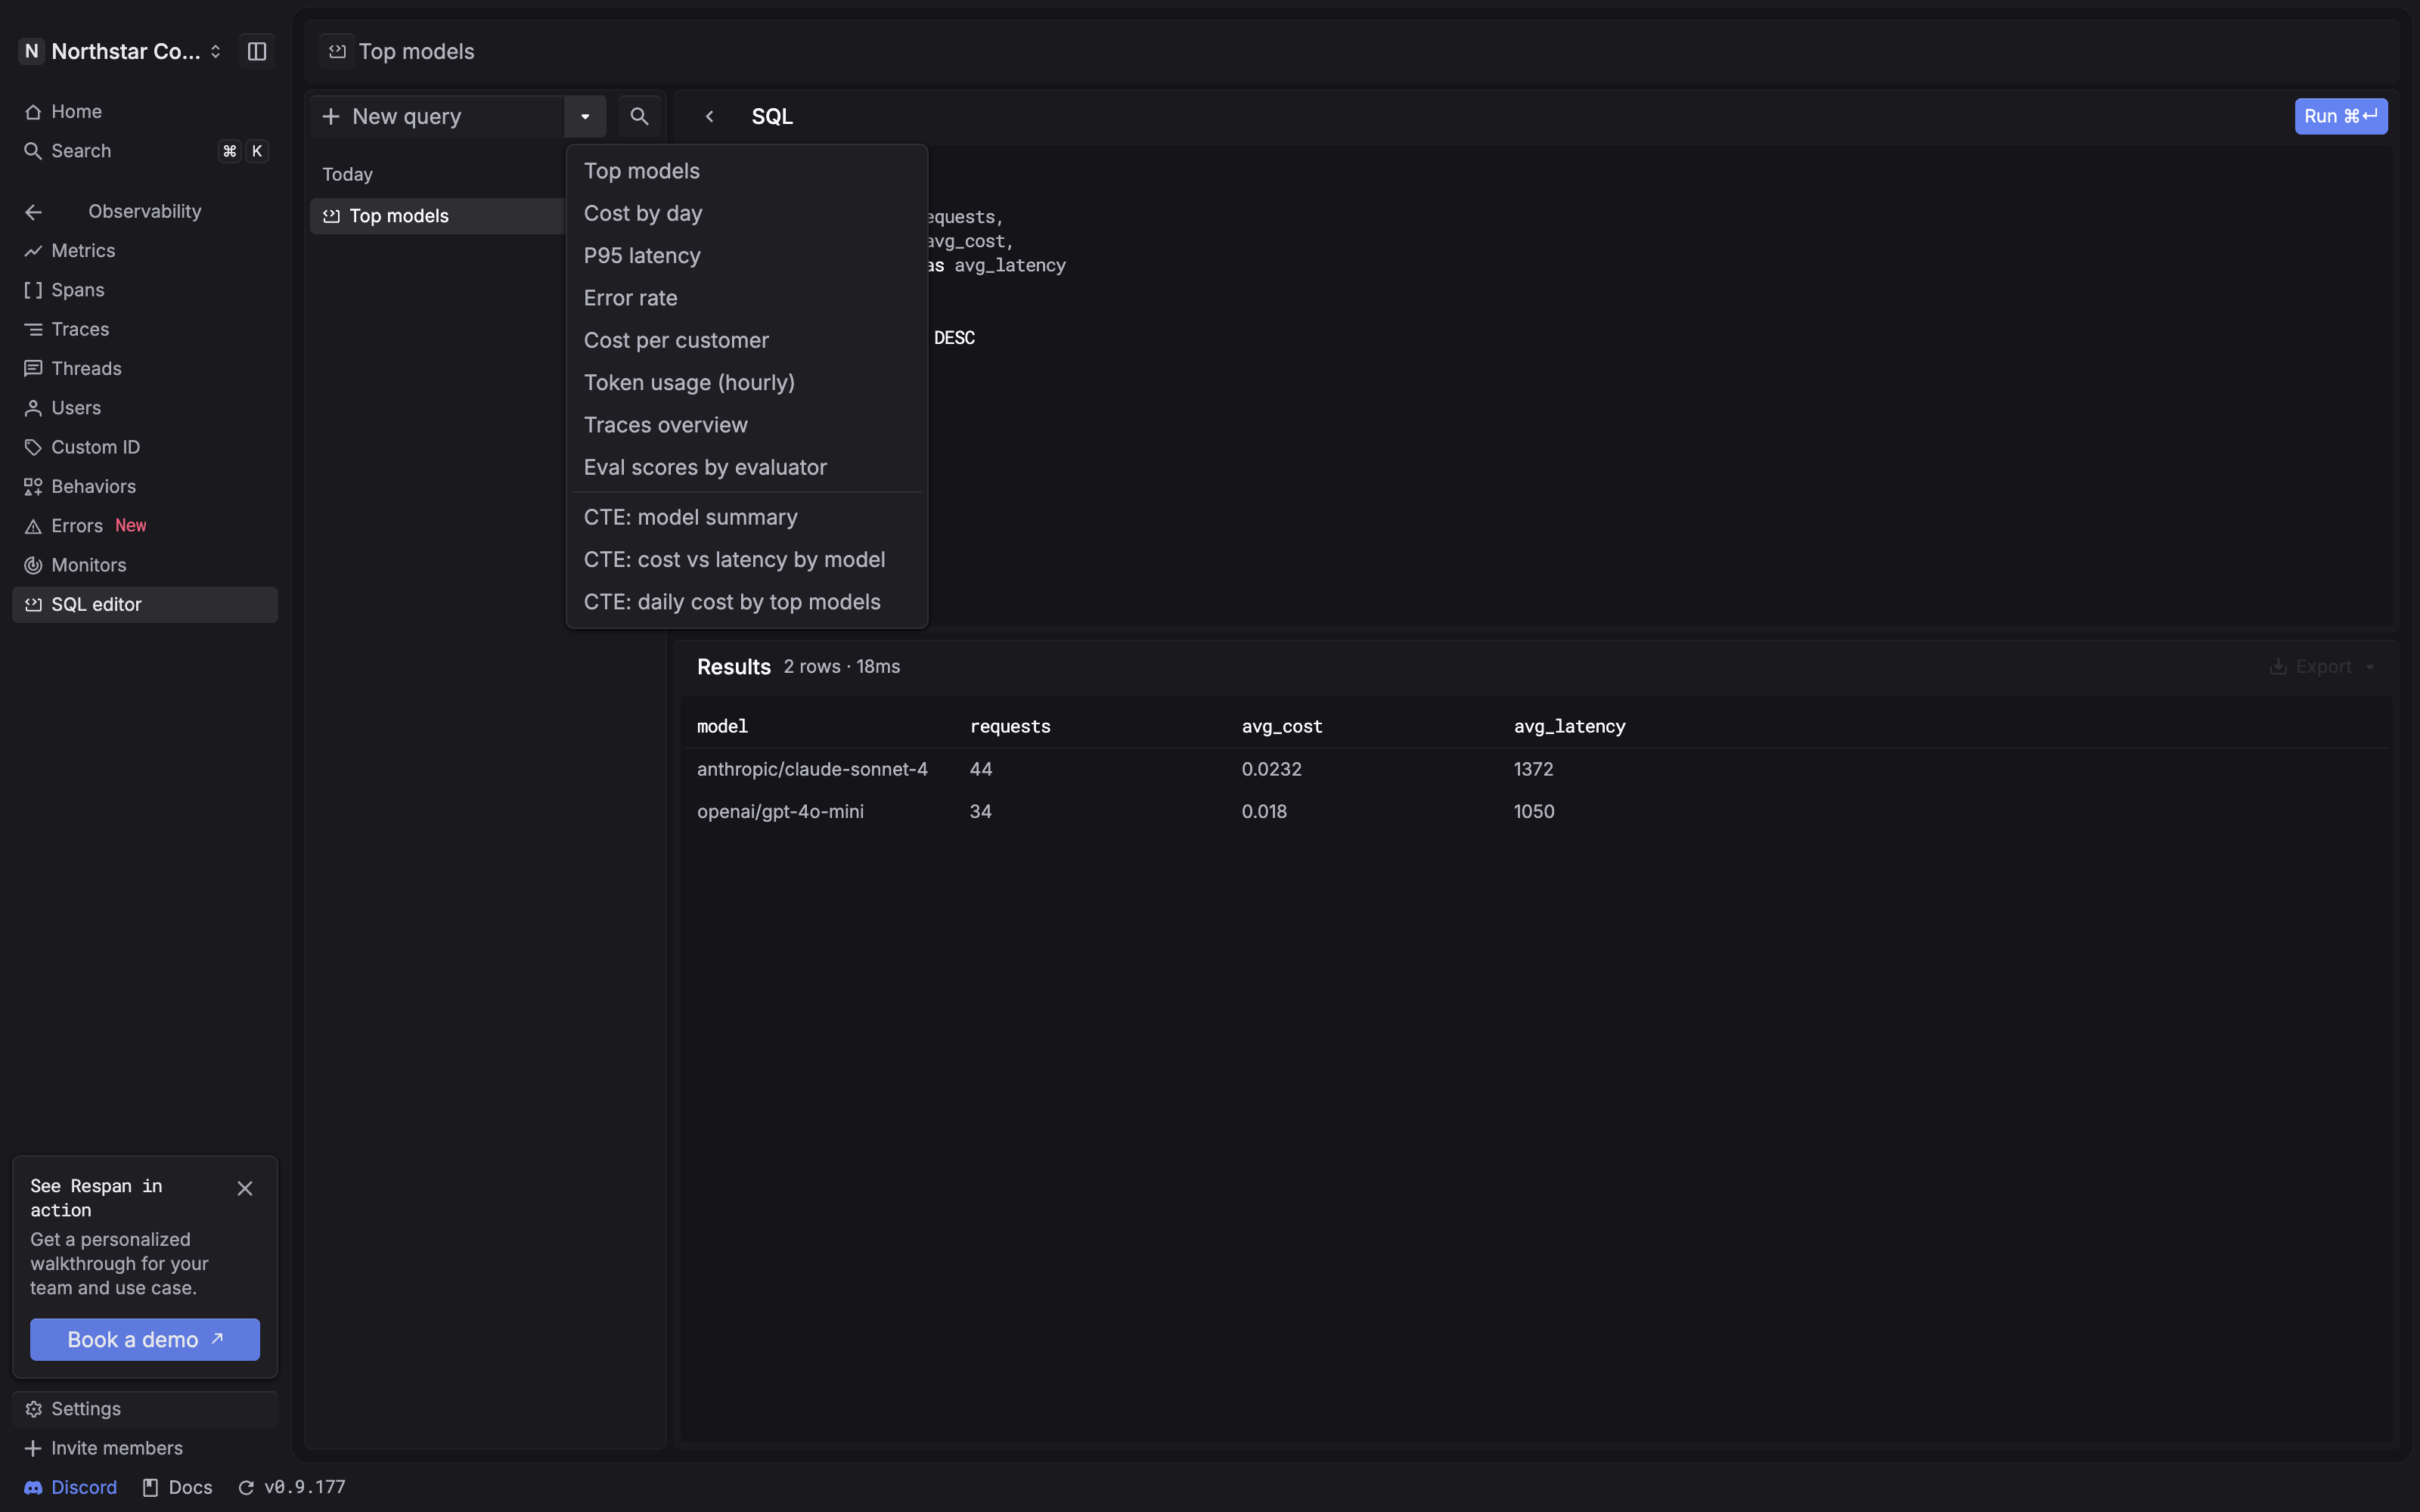
- Click the arrow beside New query and choose Top models.
- Review the SQL, then click Run. On macOS, the displayed shortcut is ⌘ Enter.
- Read the returned table below the editor. The result summary shows the row count and execution time.
The Top models example groups recorded rows by model:
The requests column counts the recorded rows for each model. avg_cost and
avg_latency show their average recorded cost and latency. The query returns
up to 20 model groups, ordered by row count.
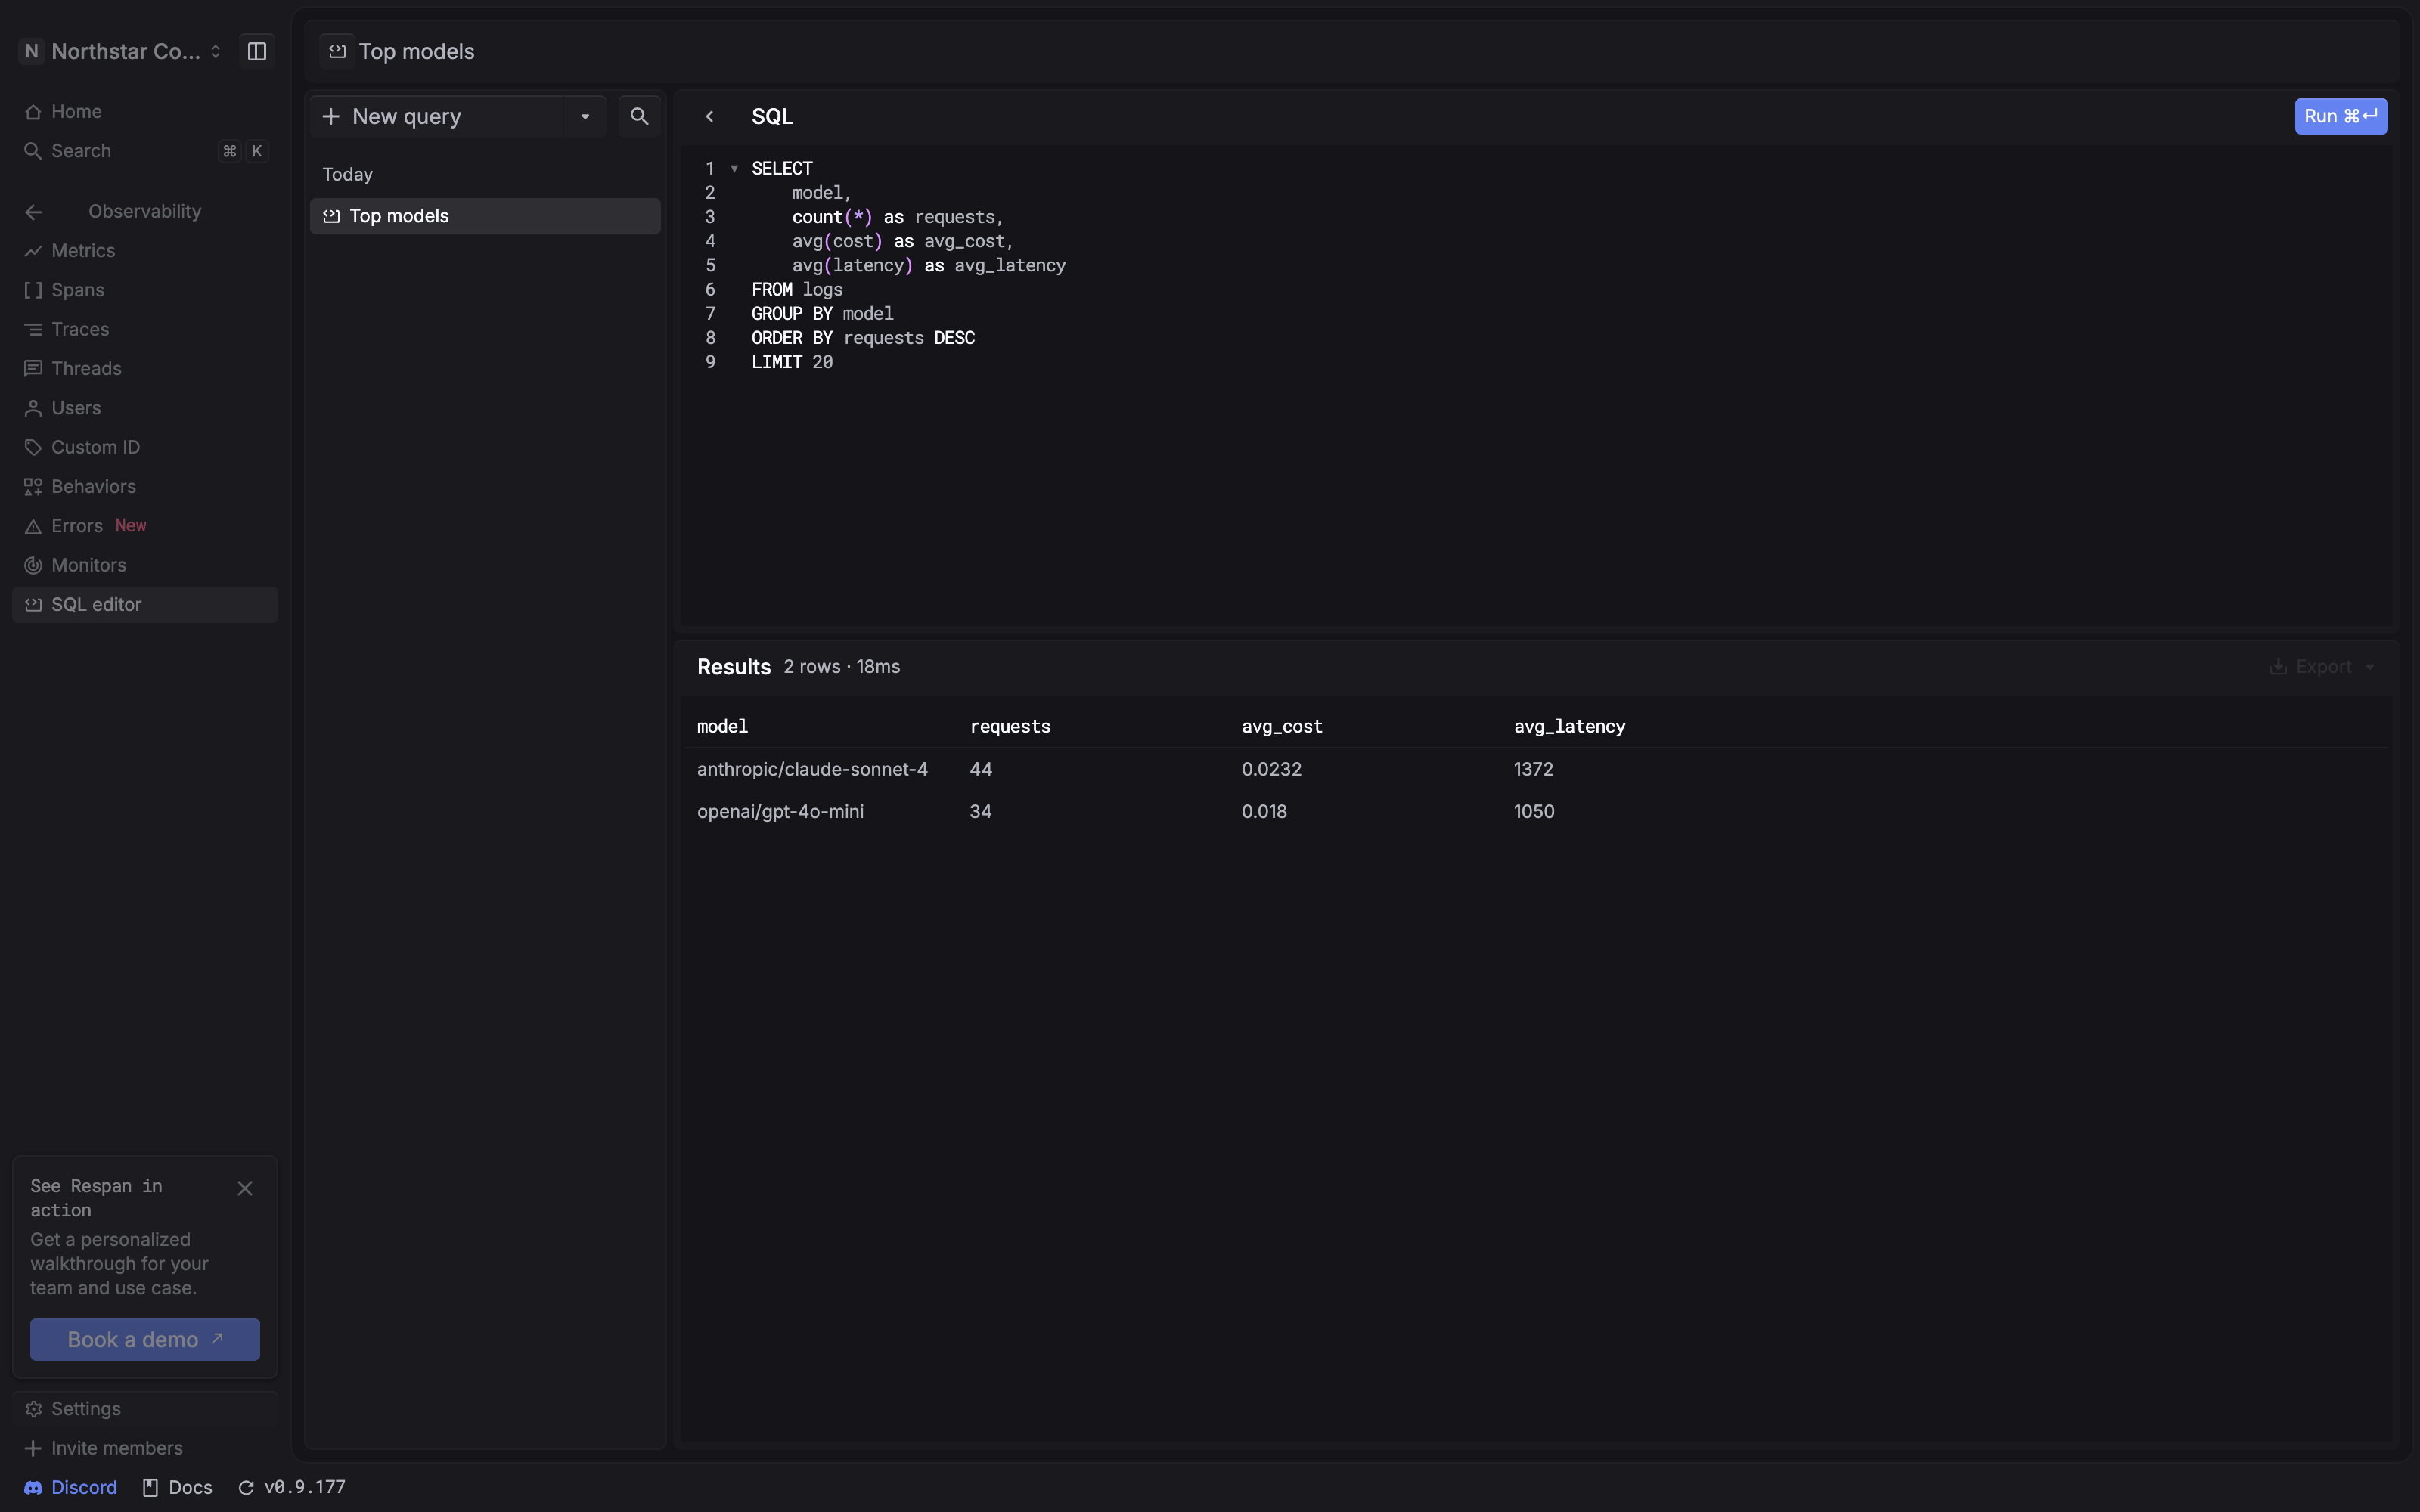
Screenshots use the Respan demo.
Your results depend on your recorded data. The logs table contains recorded spans. A trace can contain multiple spans,
so counting rows is different from counting complete traces. The example’s
requests alias names that row count.
Start from an example
Use the example menu to load SQL for a common investigation, then adapt its fields, conditions, or grouping to your question.
Narrow the query with SQL
Put conditions in the query’s WHERE clause. For example, add this line after
FROM logs and before GROUP BY model to limit the Top models query to the
last seven days:
Run the query again after changing it. The result table reflects the last execution, so check the SQL before interpreting the returned values.
Save and reopen a query
Give a useful query a descriptive name so it is easy to find again:
- Click the query title above the editor.
- Enter a name and, optionally, a description of the question it answers.
- Click Save in the query details panel.
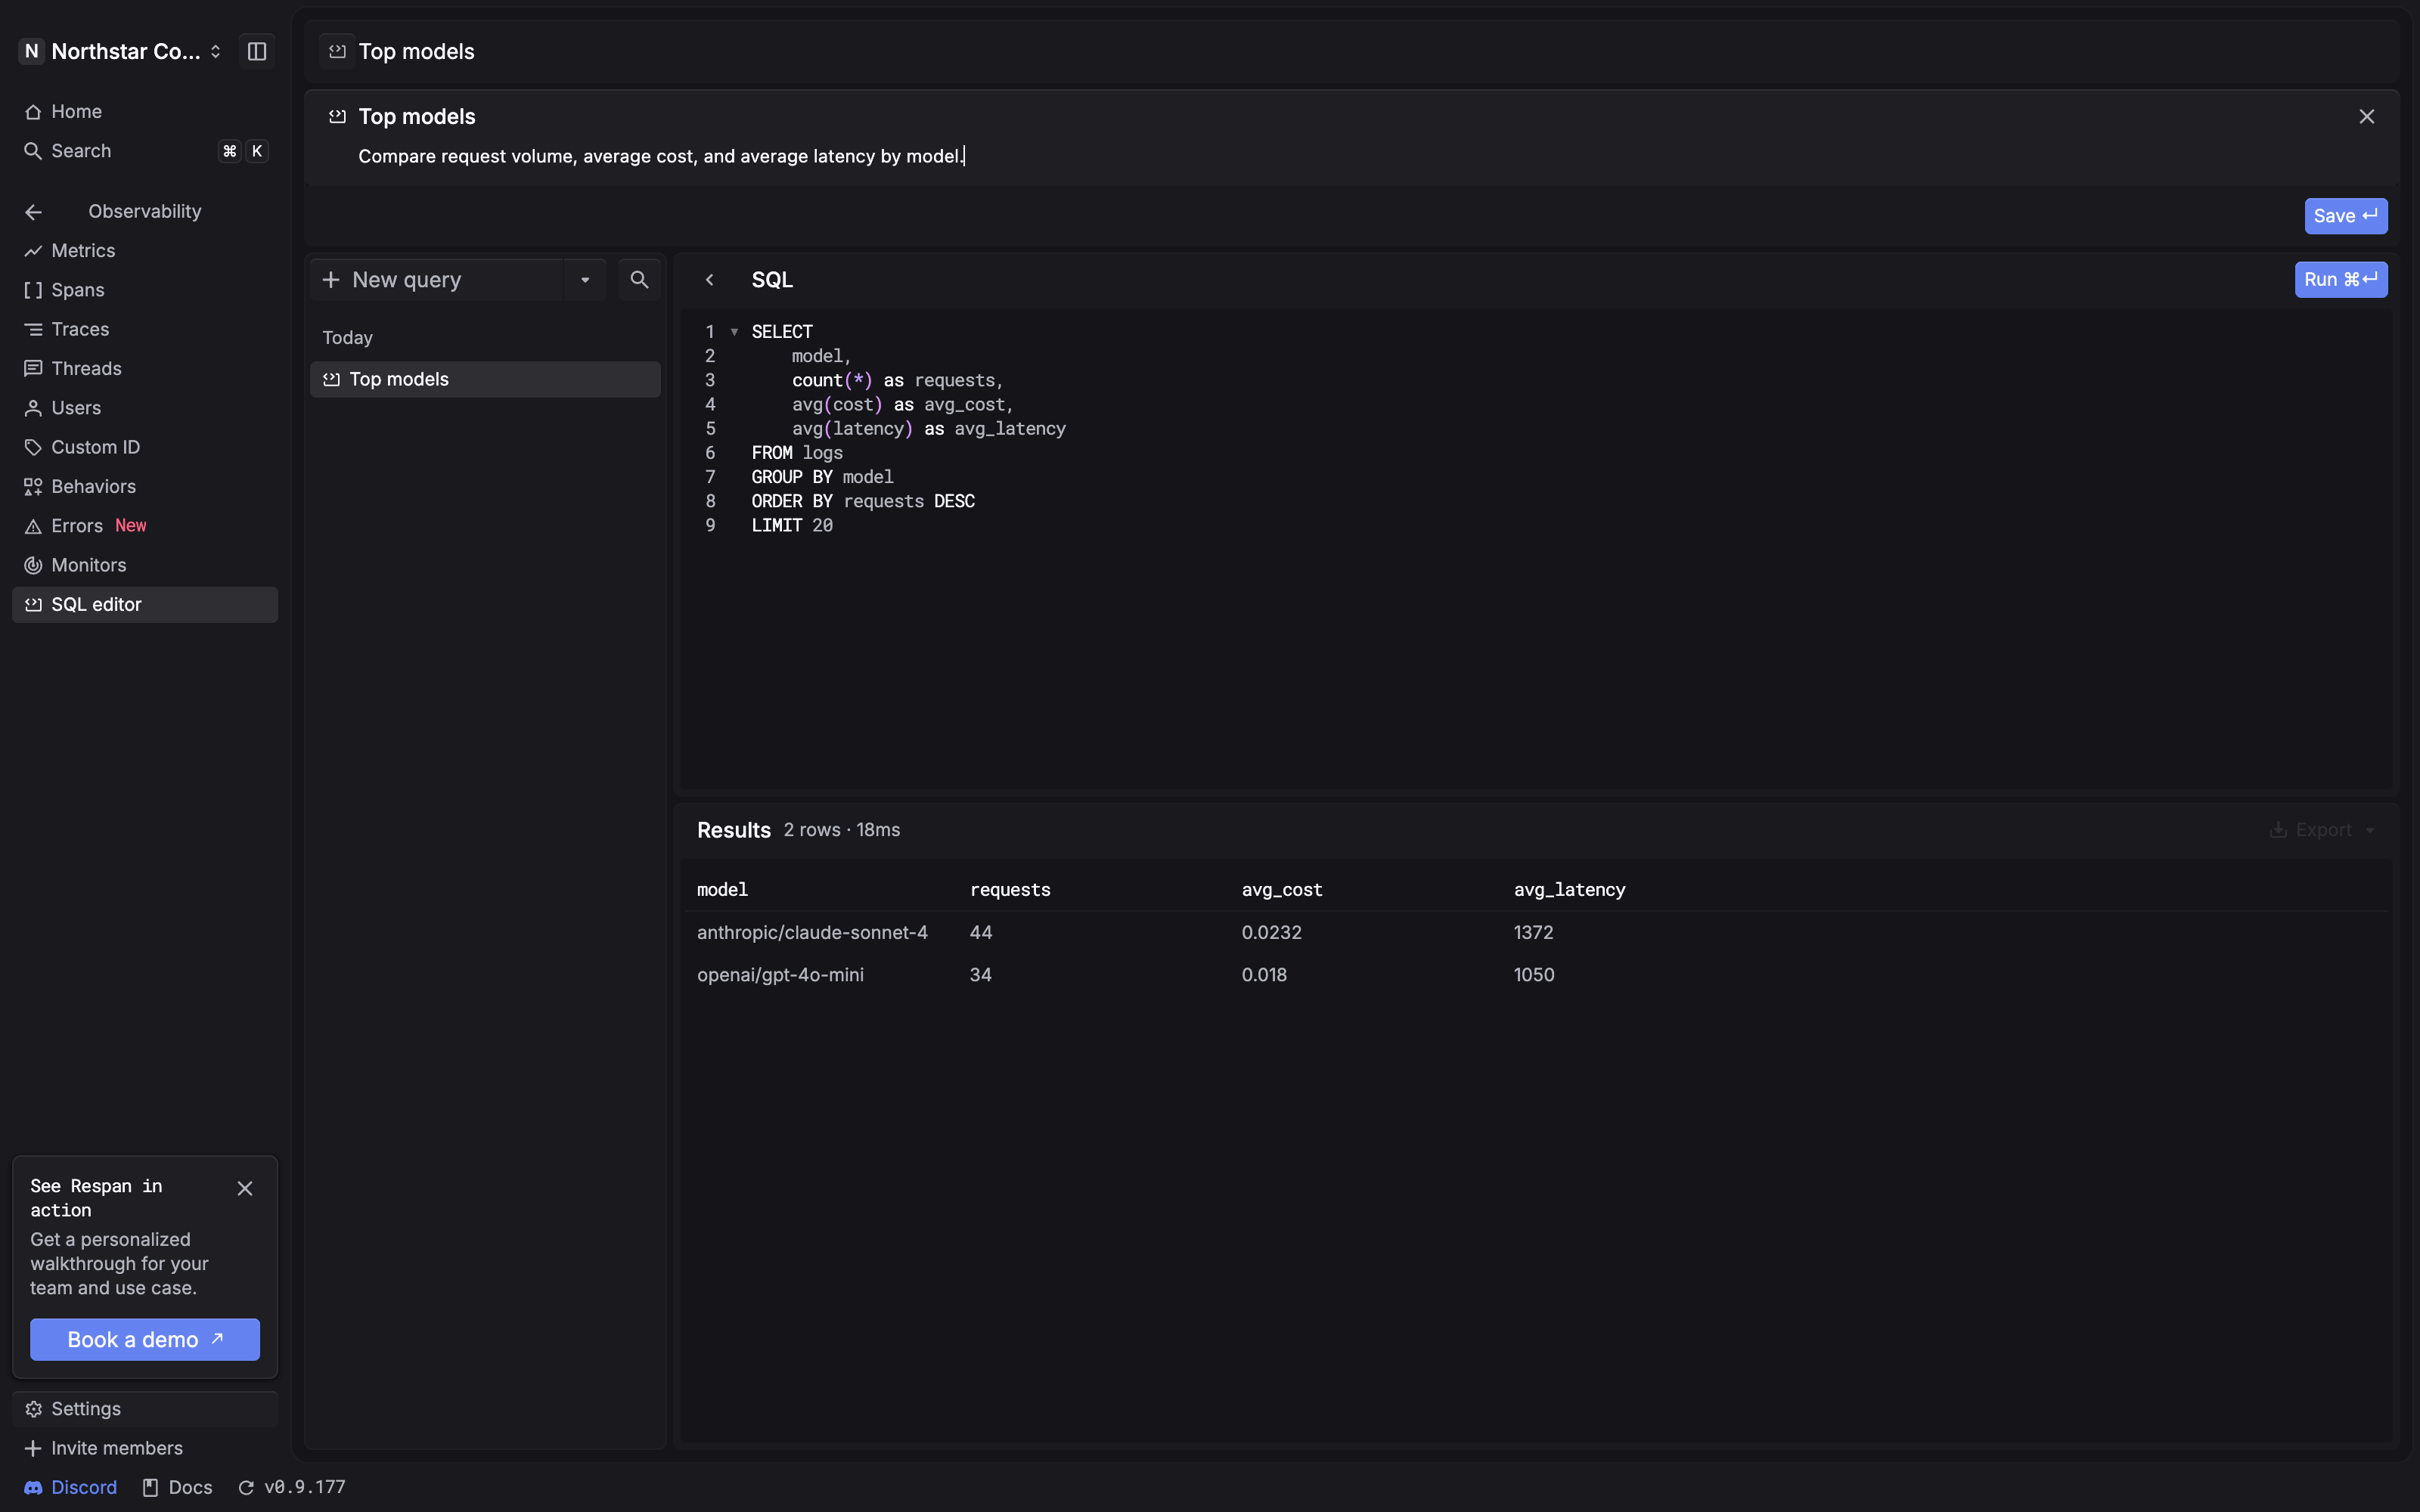
Running a new query can create an Untitled query in the saved-query list. Use Save after editing a query; on macOS, the editor shows ⌘ S as its shortcut.
Select a saved query from the list to restore its SQL and description. Click Run to fetch results again.
Export results
After a query returns results, open Export above the result table and choose Download as CSV or Download as JSON. Export is disabled in the public demo; use your project on the Respan platform to download results.
Troubleshooting
The query returns no rows
Check the query’s conditions against the data you have recorded. A short time window or a specific model condition can exclude all matching spans. Widen the interval or remove one condition at a time, then run the query again.
A field is unknown
Check its spelling and the table used by the query. Start from the closest built-in example, keep its field names, and change one part at a time.
The query covers too much data
Add a timestamp condition and select only the fields needed for the
investigation. For aggregates, narrow the input rows with WHERE before
grouping them. LIMIT controls how many result rows are returned; it does not
replace a filter on the records being analyzed.