

Online evals
Online evals are evaluator automations that score live production traffic. In the automation builder, choose whether the evaluator runs on each matching span or once on a completed trace, then add filters and a sampling rate.
Unlike experiments, which score a fixed dataset offline, online evals score whatever your users actually send. They are best paired with the Gateway: once your calls route through Respan, every production span becomes something an automation can pick up and grade automatically.
Online evals is the successor to the previous conditions-and-monitors flow. Automations now live under Evals → Automations.
How it works
An automation is made of four parts:
- Scope: the unit being evaluated: an individual span or a completed trace.
- Evaluator: a deployed evaluator pipeline that produces a score for that unit.
- Filters: optional rules that narrow the automation to matching traffic (by status, error type, customer, and more).
- Sampling rate: the percentage of matching units to evaluate, so you control eval cost on high-volume traffic.
When a span or completed trace matches the filters and is picked by the sampler, the automation runs the evaluator and attaches the resulting score. You can then watch scores trend over time and drill into individual results.
Choose Span or Trace scope
Scope changes both when an automation runs and what the evaluator receives.
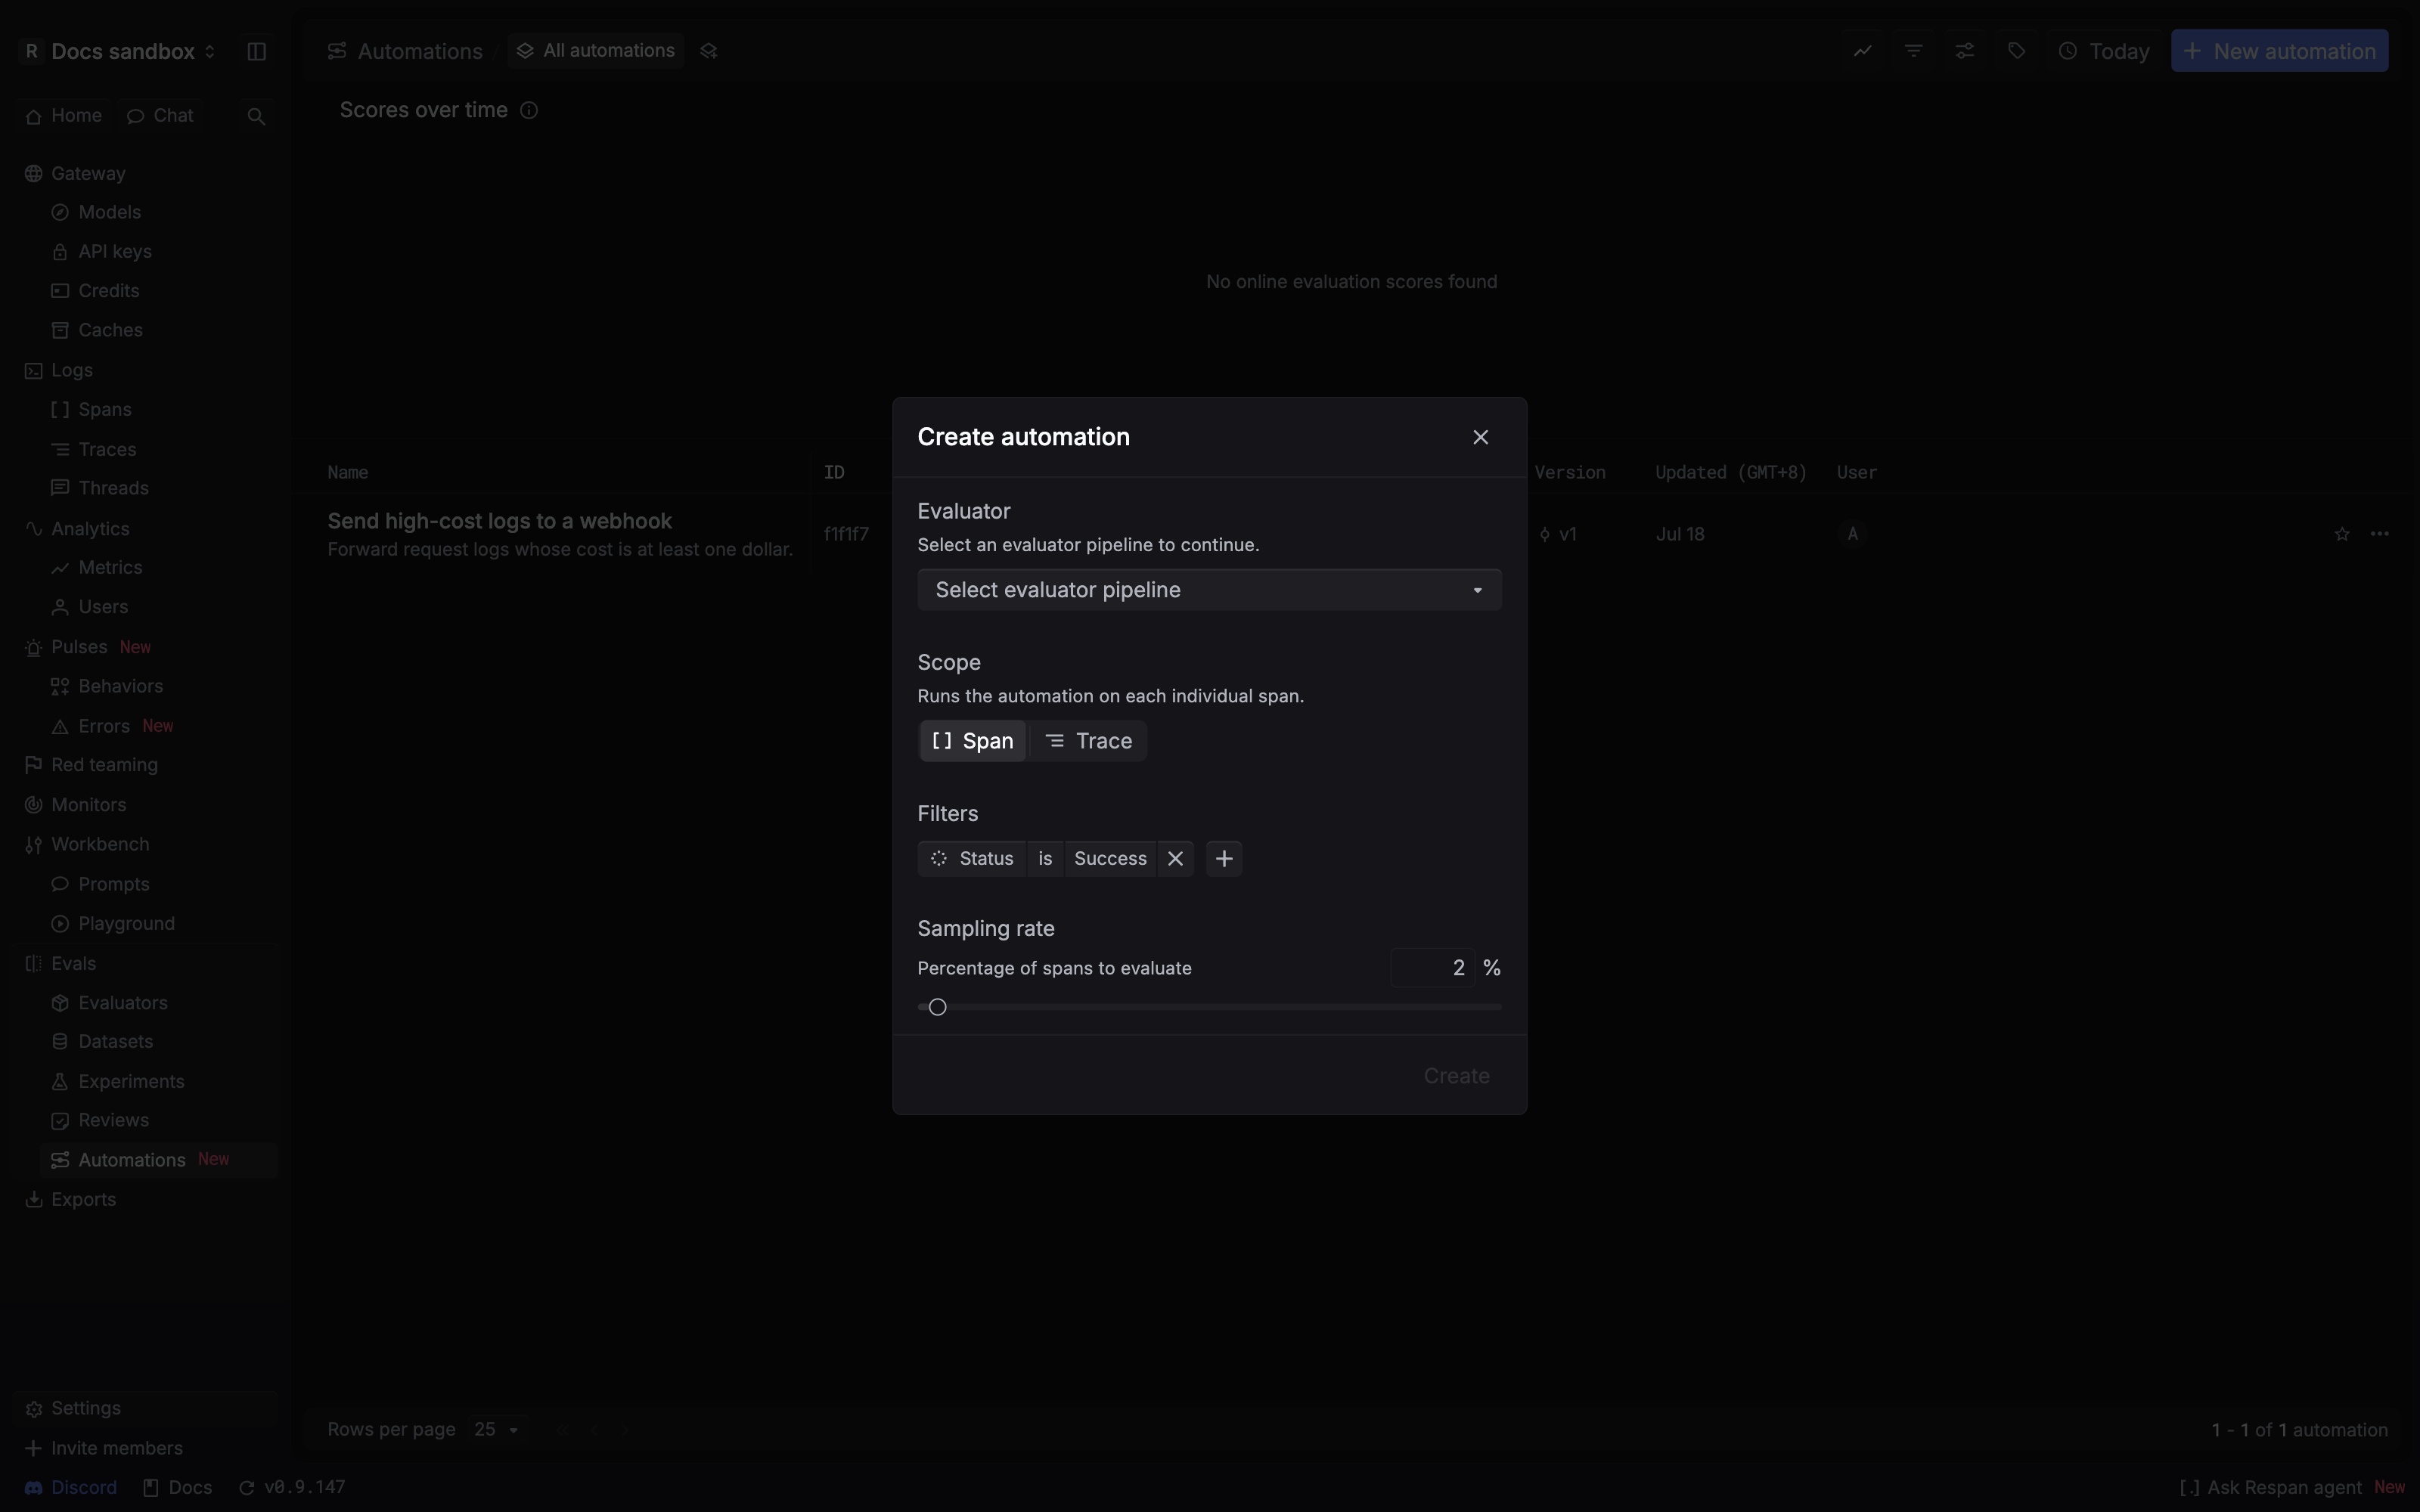
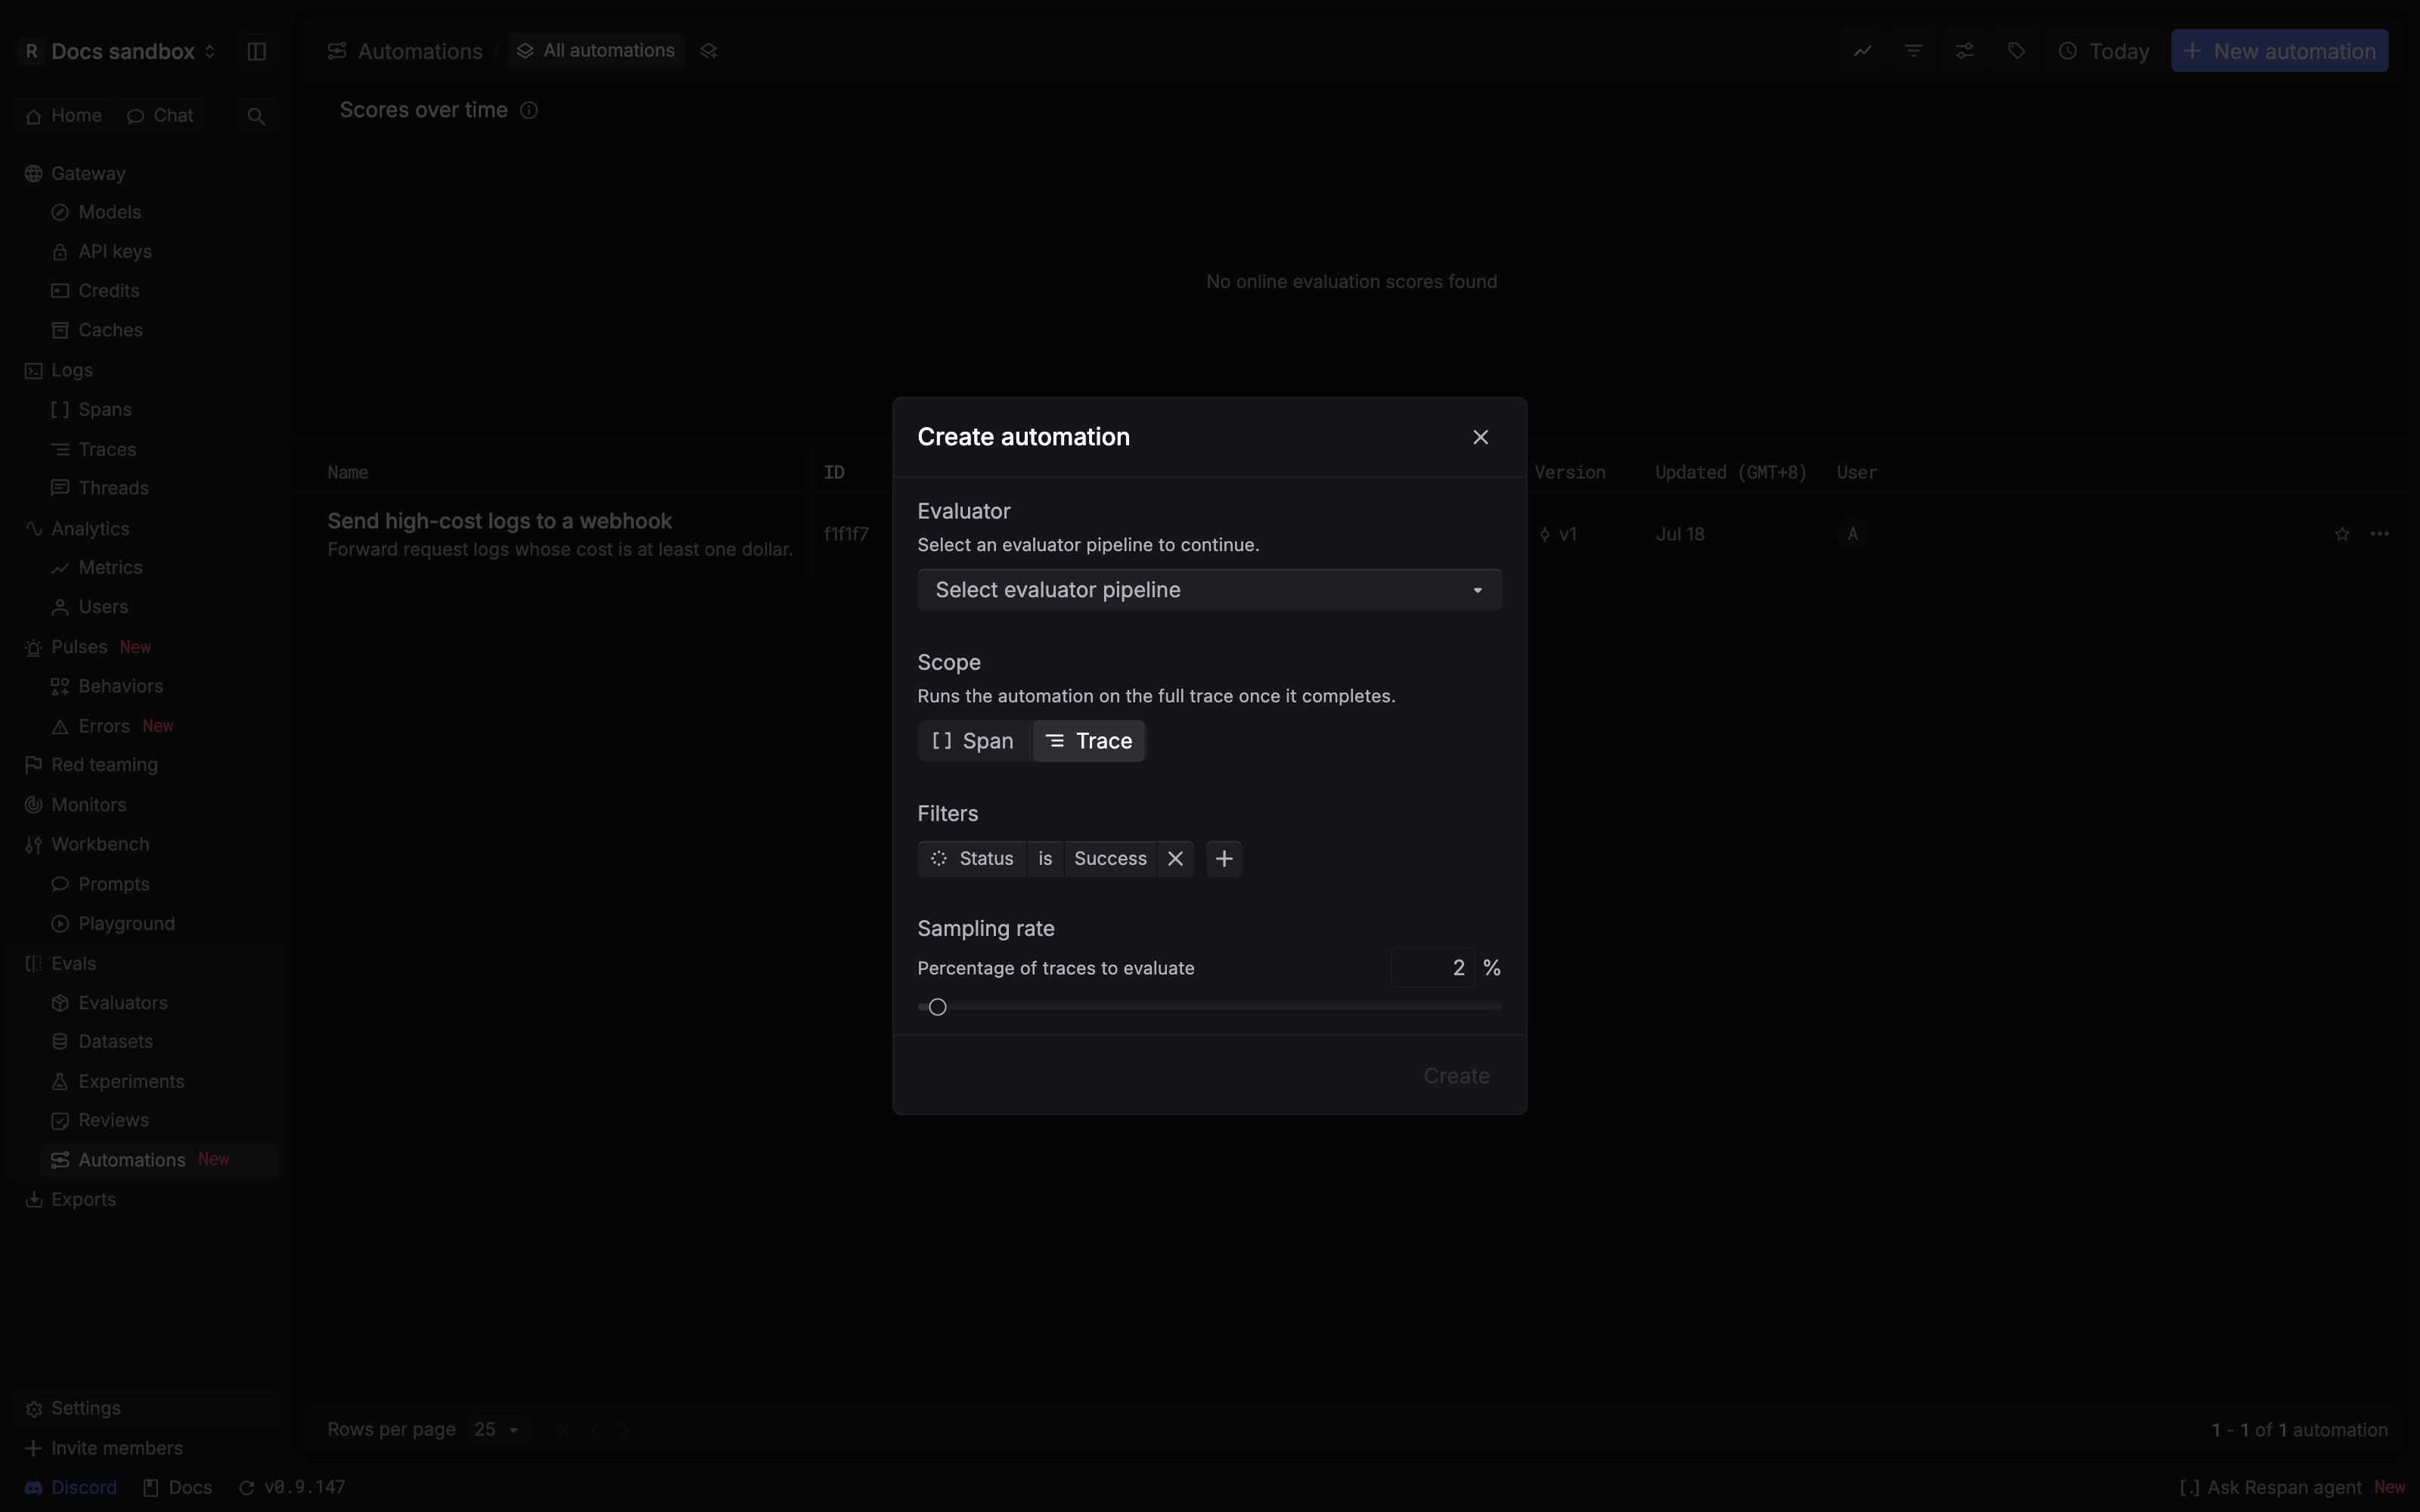
Use Span when every matching operation should be graded independently. Use Trace when a score would be misleading without the earlier steps, tool calls, or final outcome. Sampling applies after the selected scope and filters determine which units are eligible.
Prerequisites
To run your first online eval you need two things:
- A deployed evaluator pipeline. Automations run a pipeline that has been deployed. If you don’t have one yet, follow Building your first LLM eval and deploy it.
- Production traffic in Respan. A Span automation grades individual spans. A Trace automation needs complete traces. The simplest way to get model-call spans is to route calls through the Gateway; use a tracing integration when you need end-to-end trace structure.
Walkthrough
Open Automations
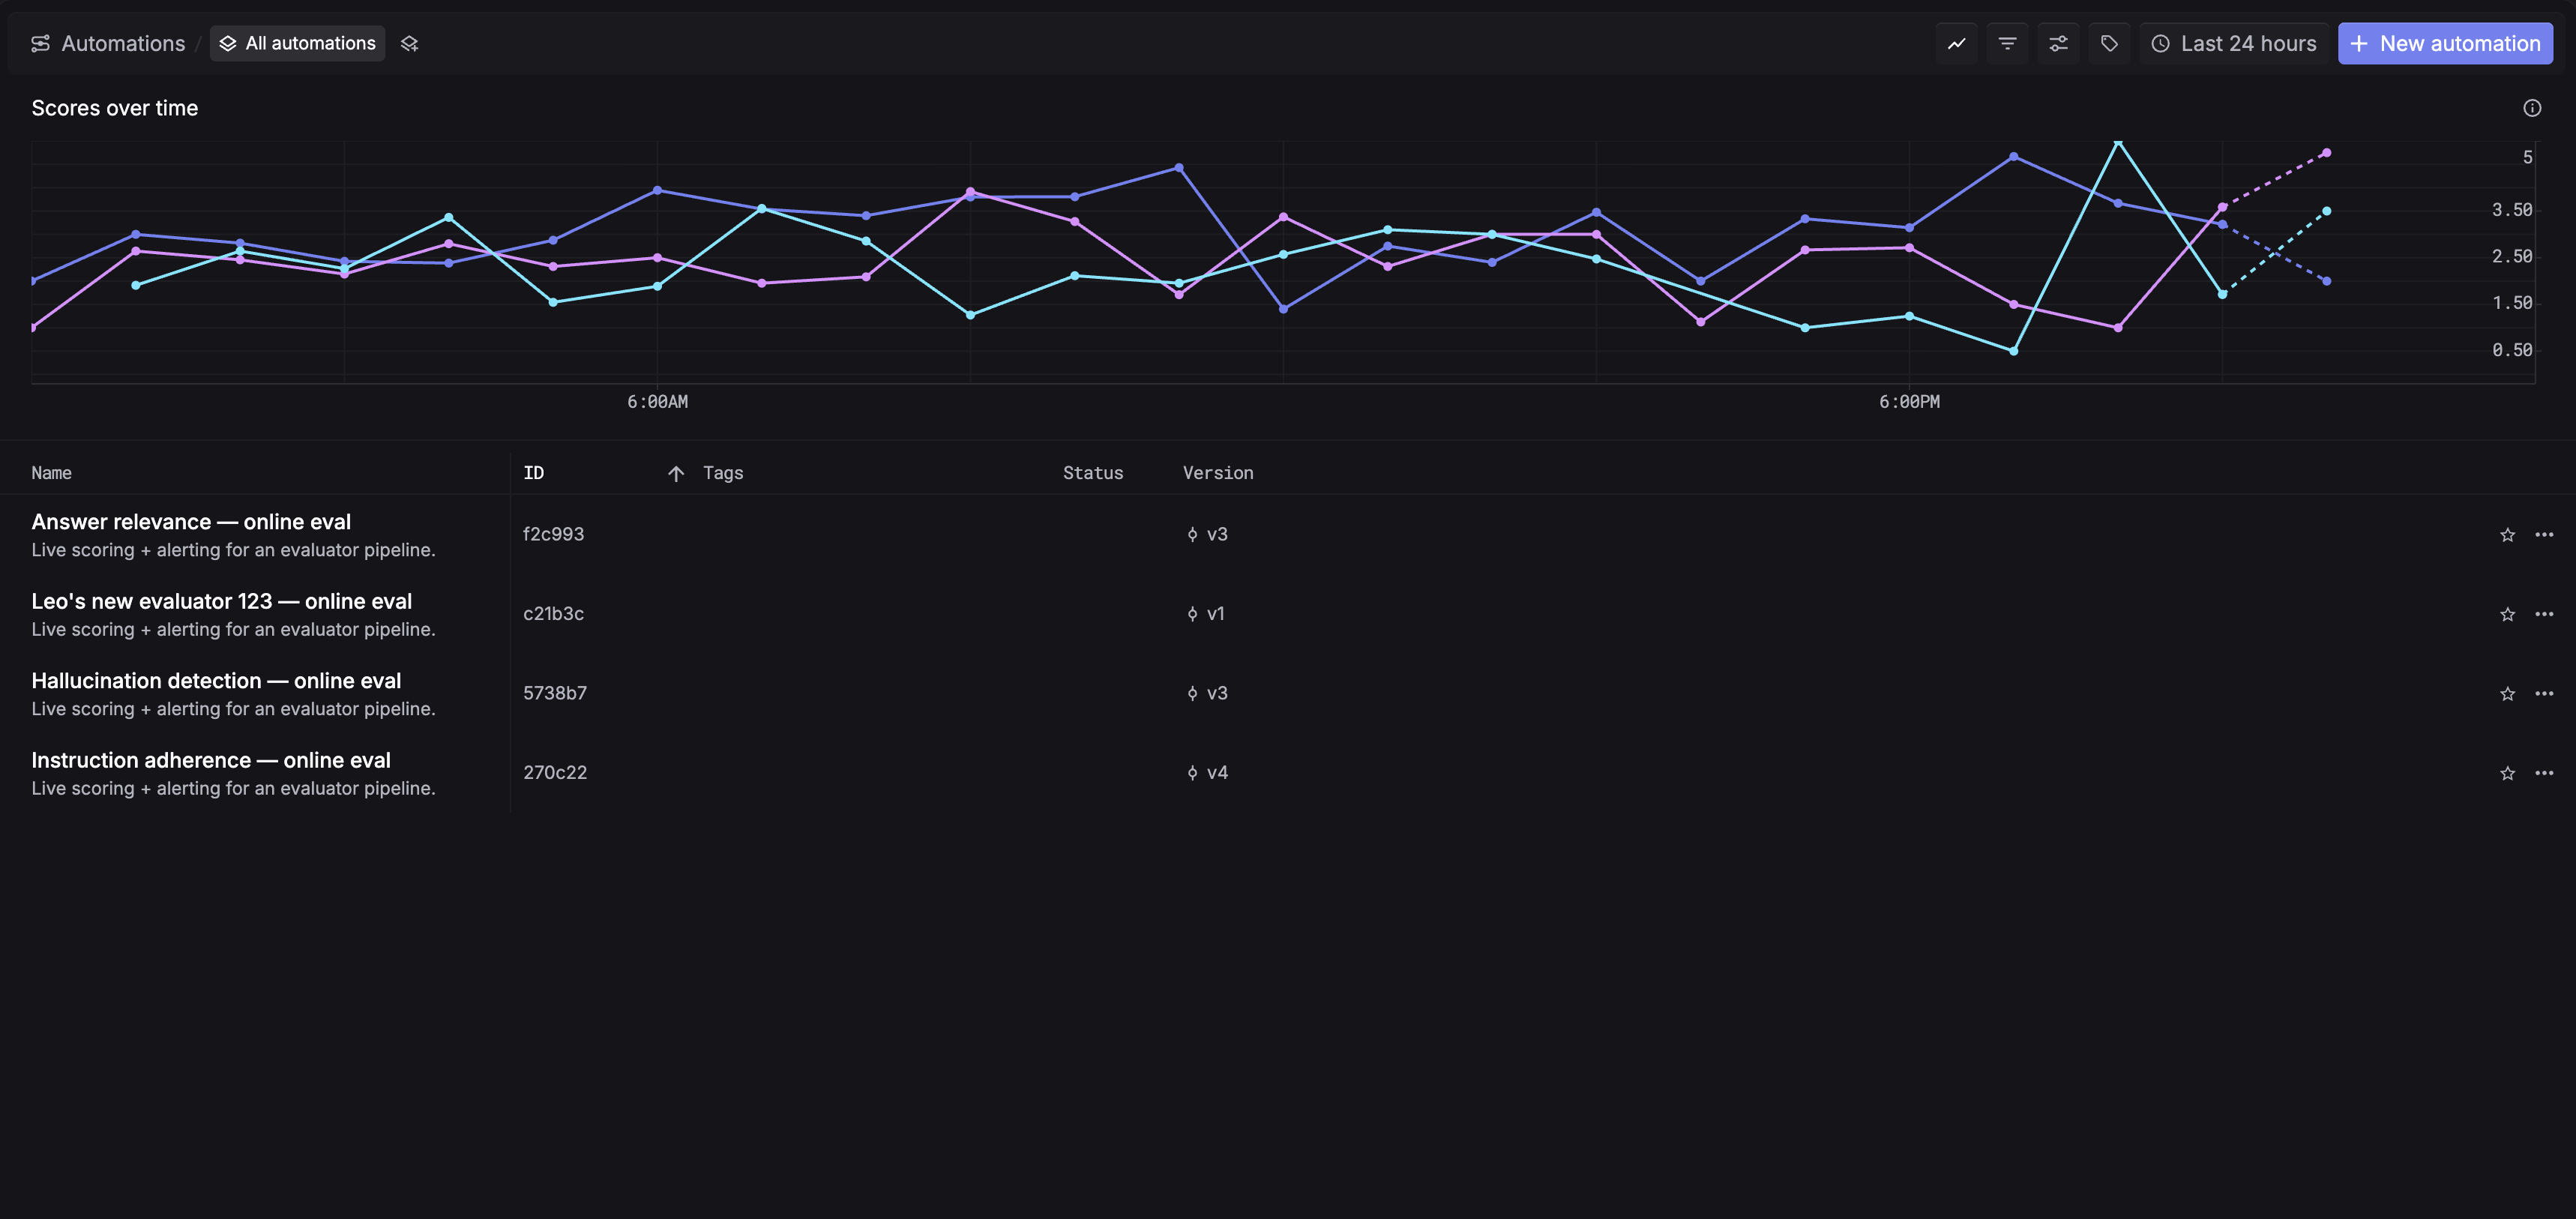
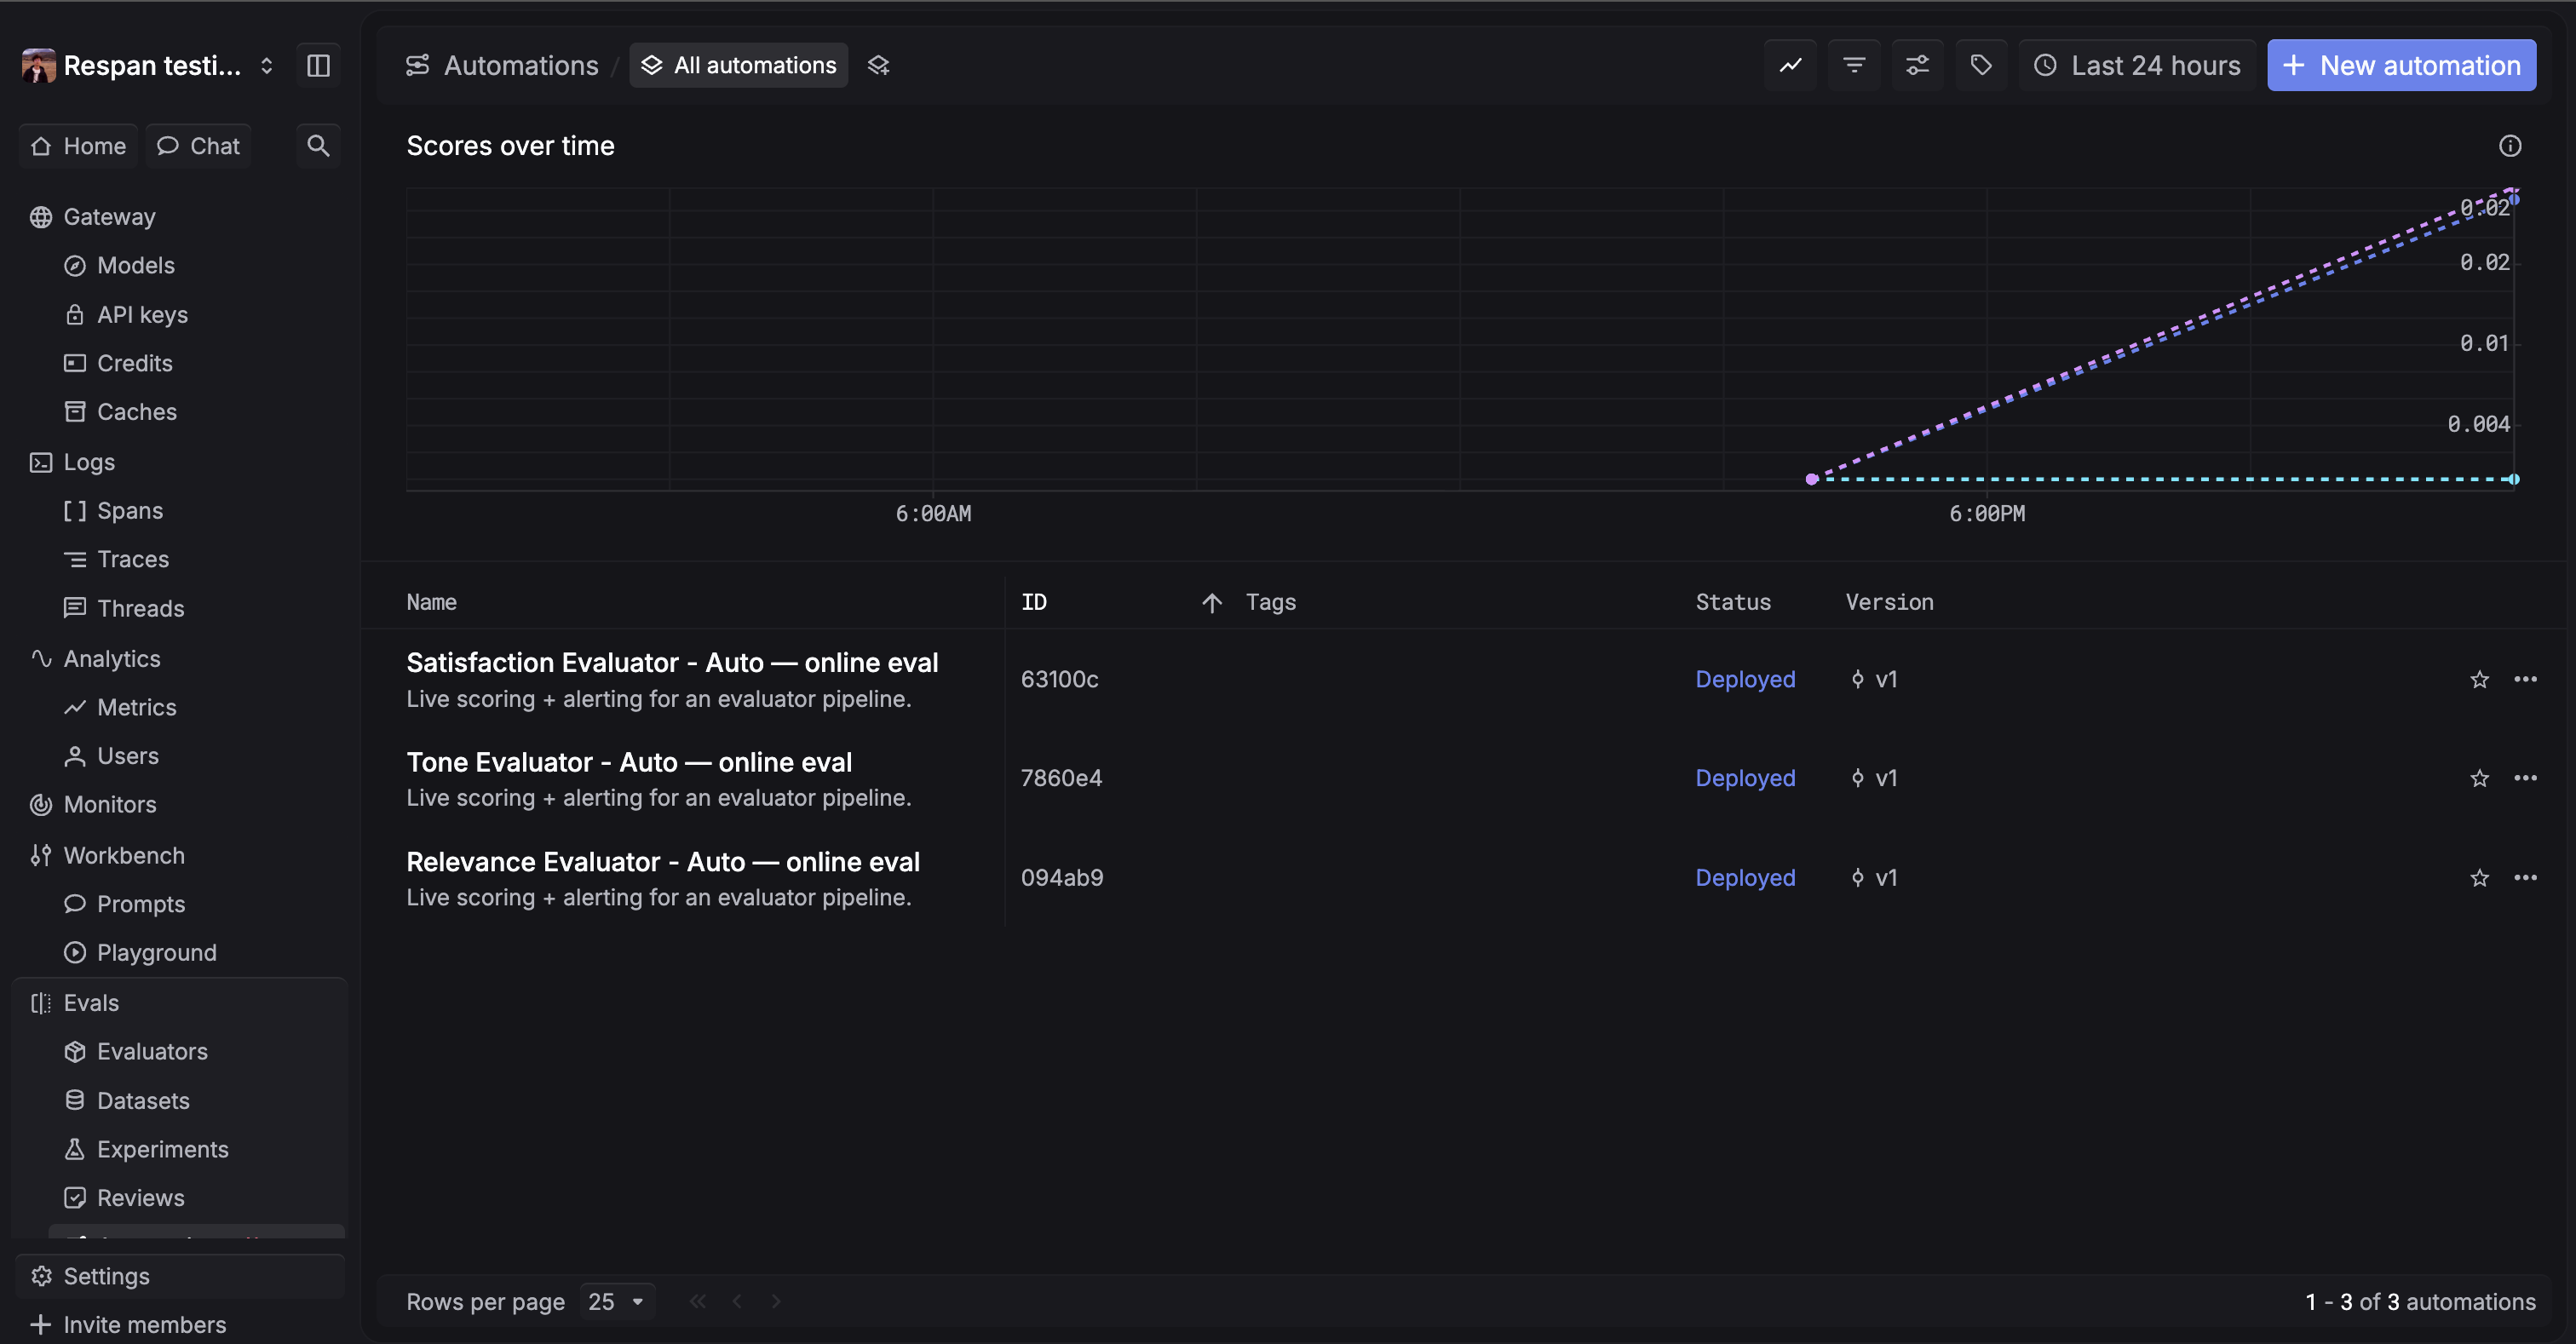
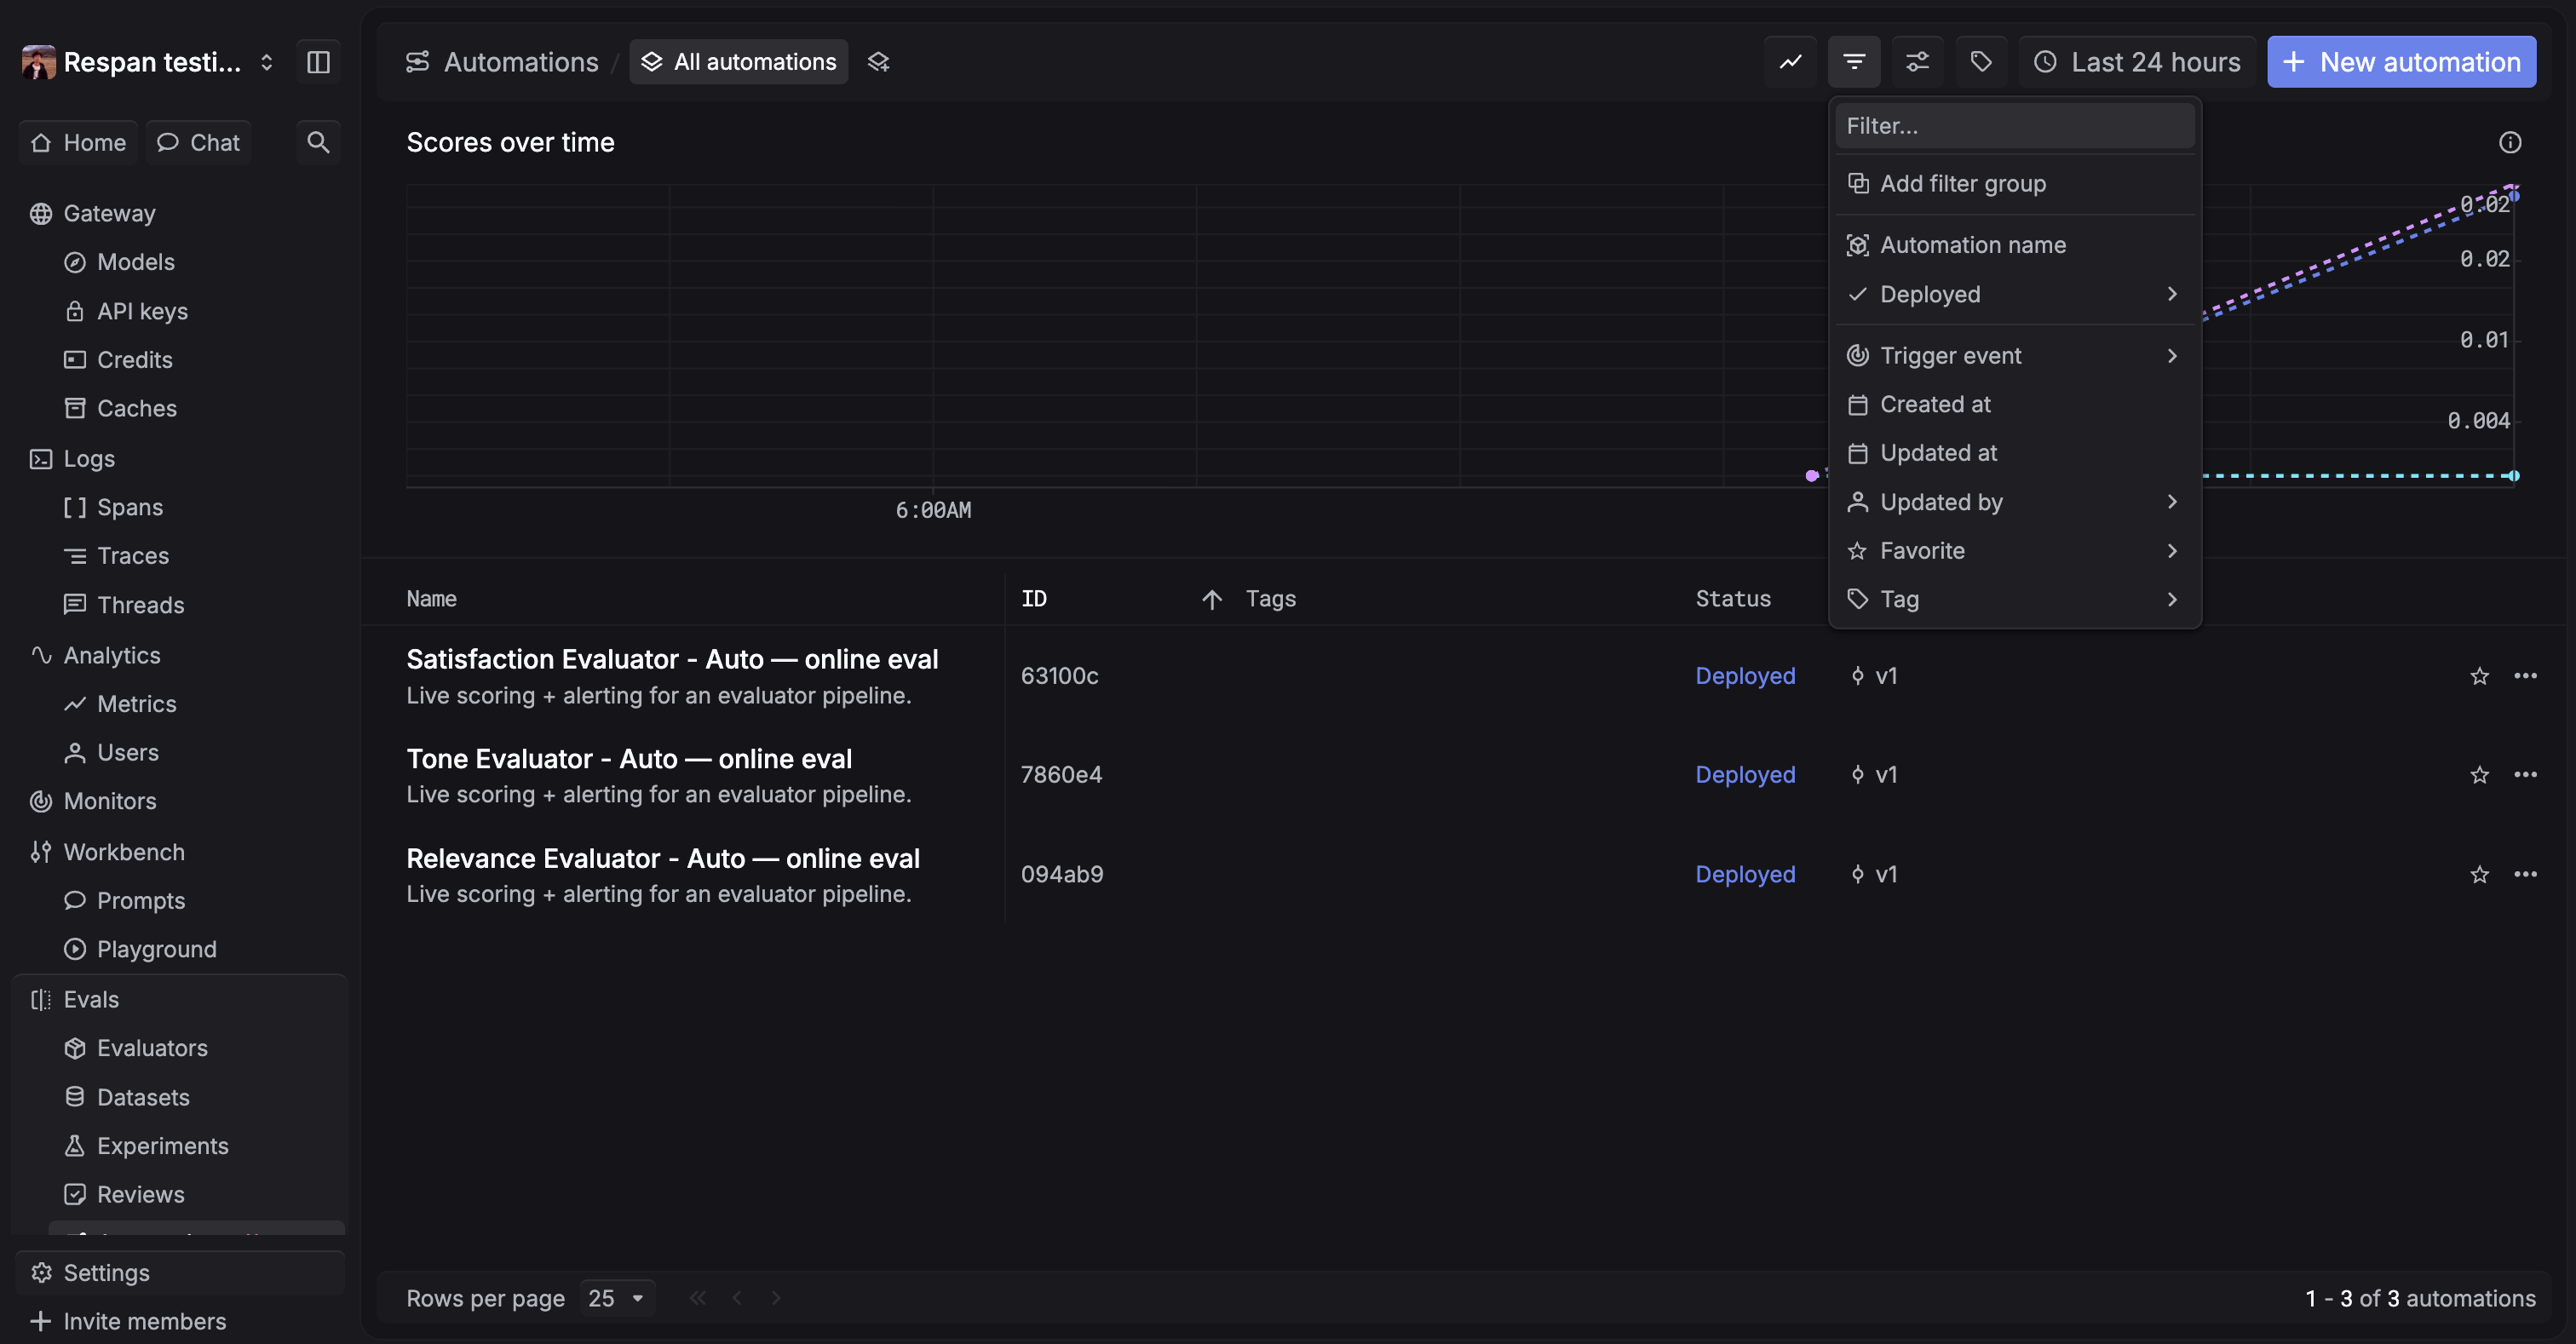
In the sidebar, go to Evals → Automations. This page lists every automation in your project, with a Scores over time chart across the top and each automation’s Status and Version.
Click New automation in the top right.
Choose an evaluator pipeline
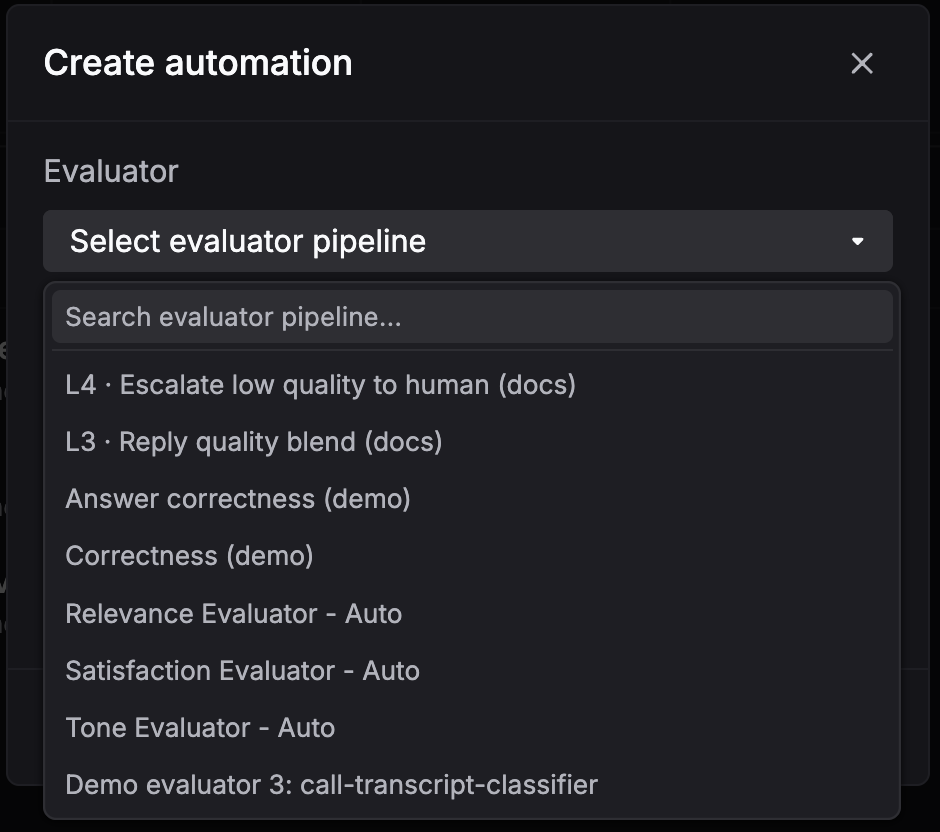
In the Create automation dialog, open the Evaluator dropdown and select a deployed evaluator pipeline. This is the evaluator that will score each sampled unit.
Choose the evaluation scope
Select Span to evaluate each individual matching span, or Trace to evaluate the full trace once it completes. Use the decision table above if you are unsure.
Changing scope changes the evaluator input. Confirm that the evaluator pipeline expects span-level fields for Span scope or trace-level context for Trace scope before creating the automation.
Add filters (optional)
Under Filters, click + Filter to narrow the automation to a subset of traffic. You can filter on attributes such as status, status code, error type, customer, and thread. Only units that match every filter are eligible for evaluation. Leave filters empty to consider all traffic for the selected scope.
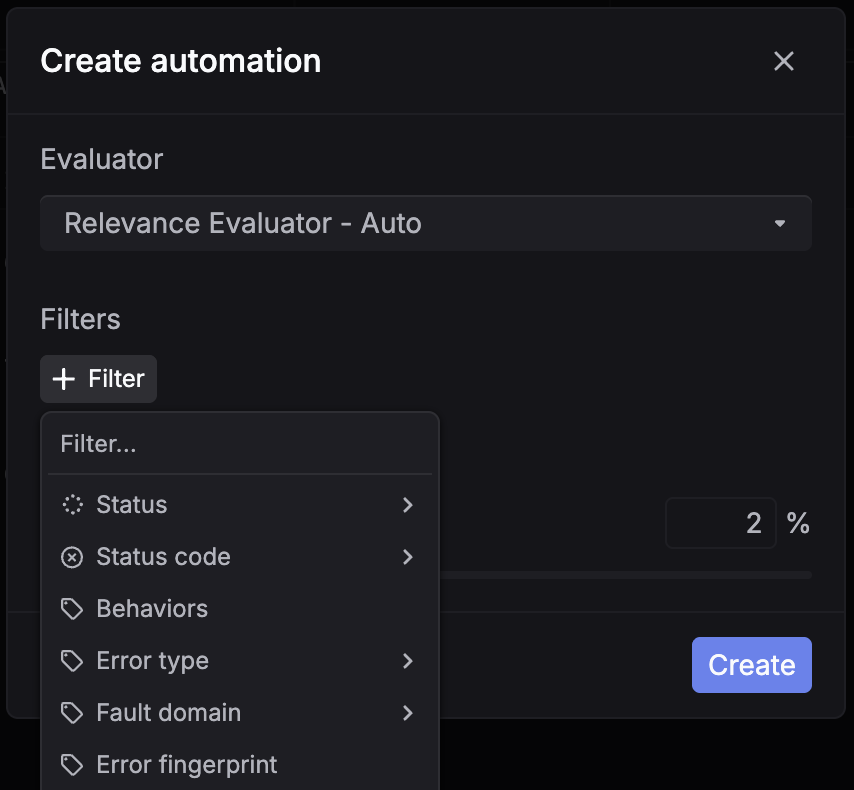
Filtering to error spans (for example, Status code ≥ 500) is a cheap way to grade only the traffic most likely to be a problem.
Set the sampling rate
Set Sampling rate, the percentage of matching spans or traces to evaluate. On high-volume traffic, a low rate (for example, 2%) gives you a representative quality signal while keeping eval cost predictable. Raise it toward 100% for low-volume or high-stakes traffic where you want to grade nearly everything.
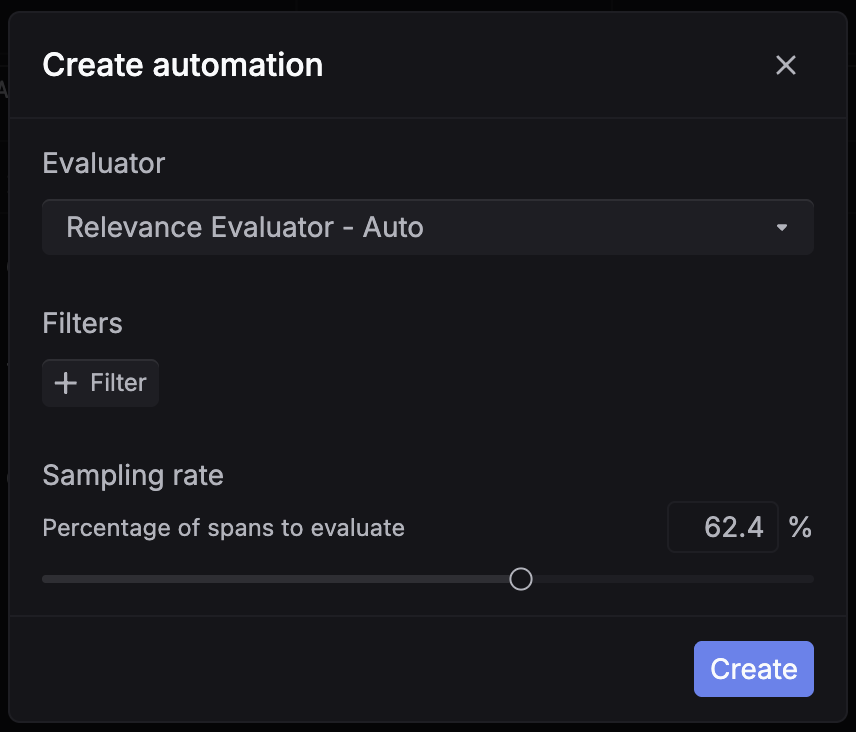
Click Create. The automation is deployed immediately and starts scoring new production spans as they arrive.
Read the results
Open the automation from the list to see its detail page. The Metrics tab shows a Scores over time chart and a table of every evaluated span; the JSON tab shows the raw configuration. Use the time-range selector (Today, Last 24 hours, Last 7 days, Last 30 days) to change the window.
For a Span automation, the results table has one row per evaluated span. For a Trace automation, interpret each result as one completed trace rather than one child operation.
Click any row to open the span and its full score in the sidepanel.
Manage automations from the Spans page
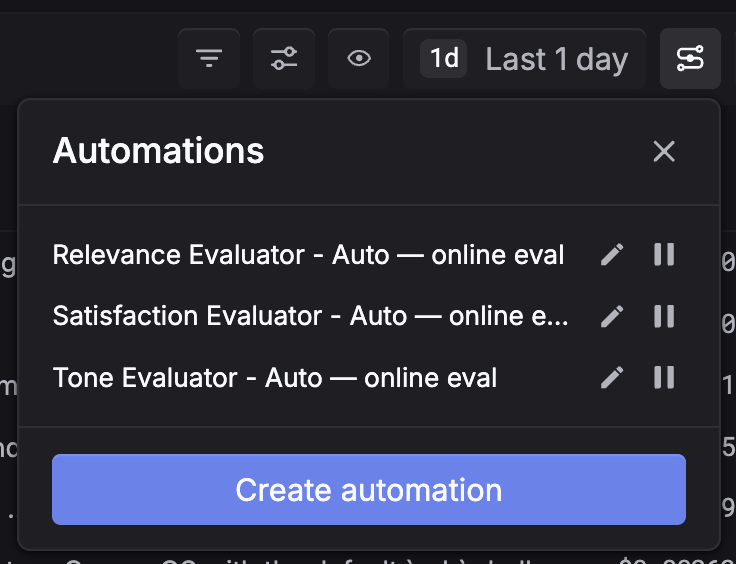
You don’t have to leave your traffic to manage automations. Open Logs → Spans and click the automations icon in the toolbar to open the Automations panel, which shows how many automations are live versus paused and lets you act on each one without losing your place in the logs.
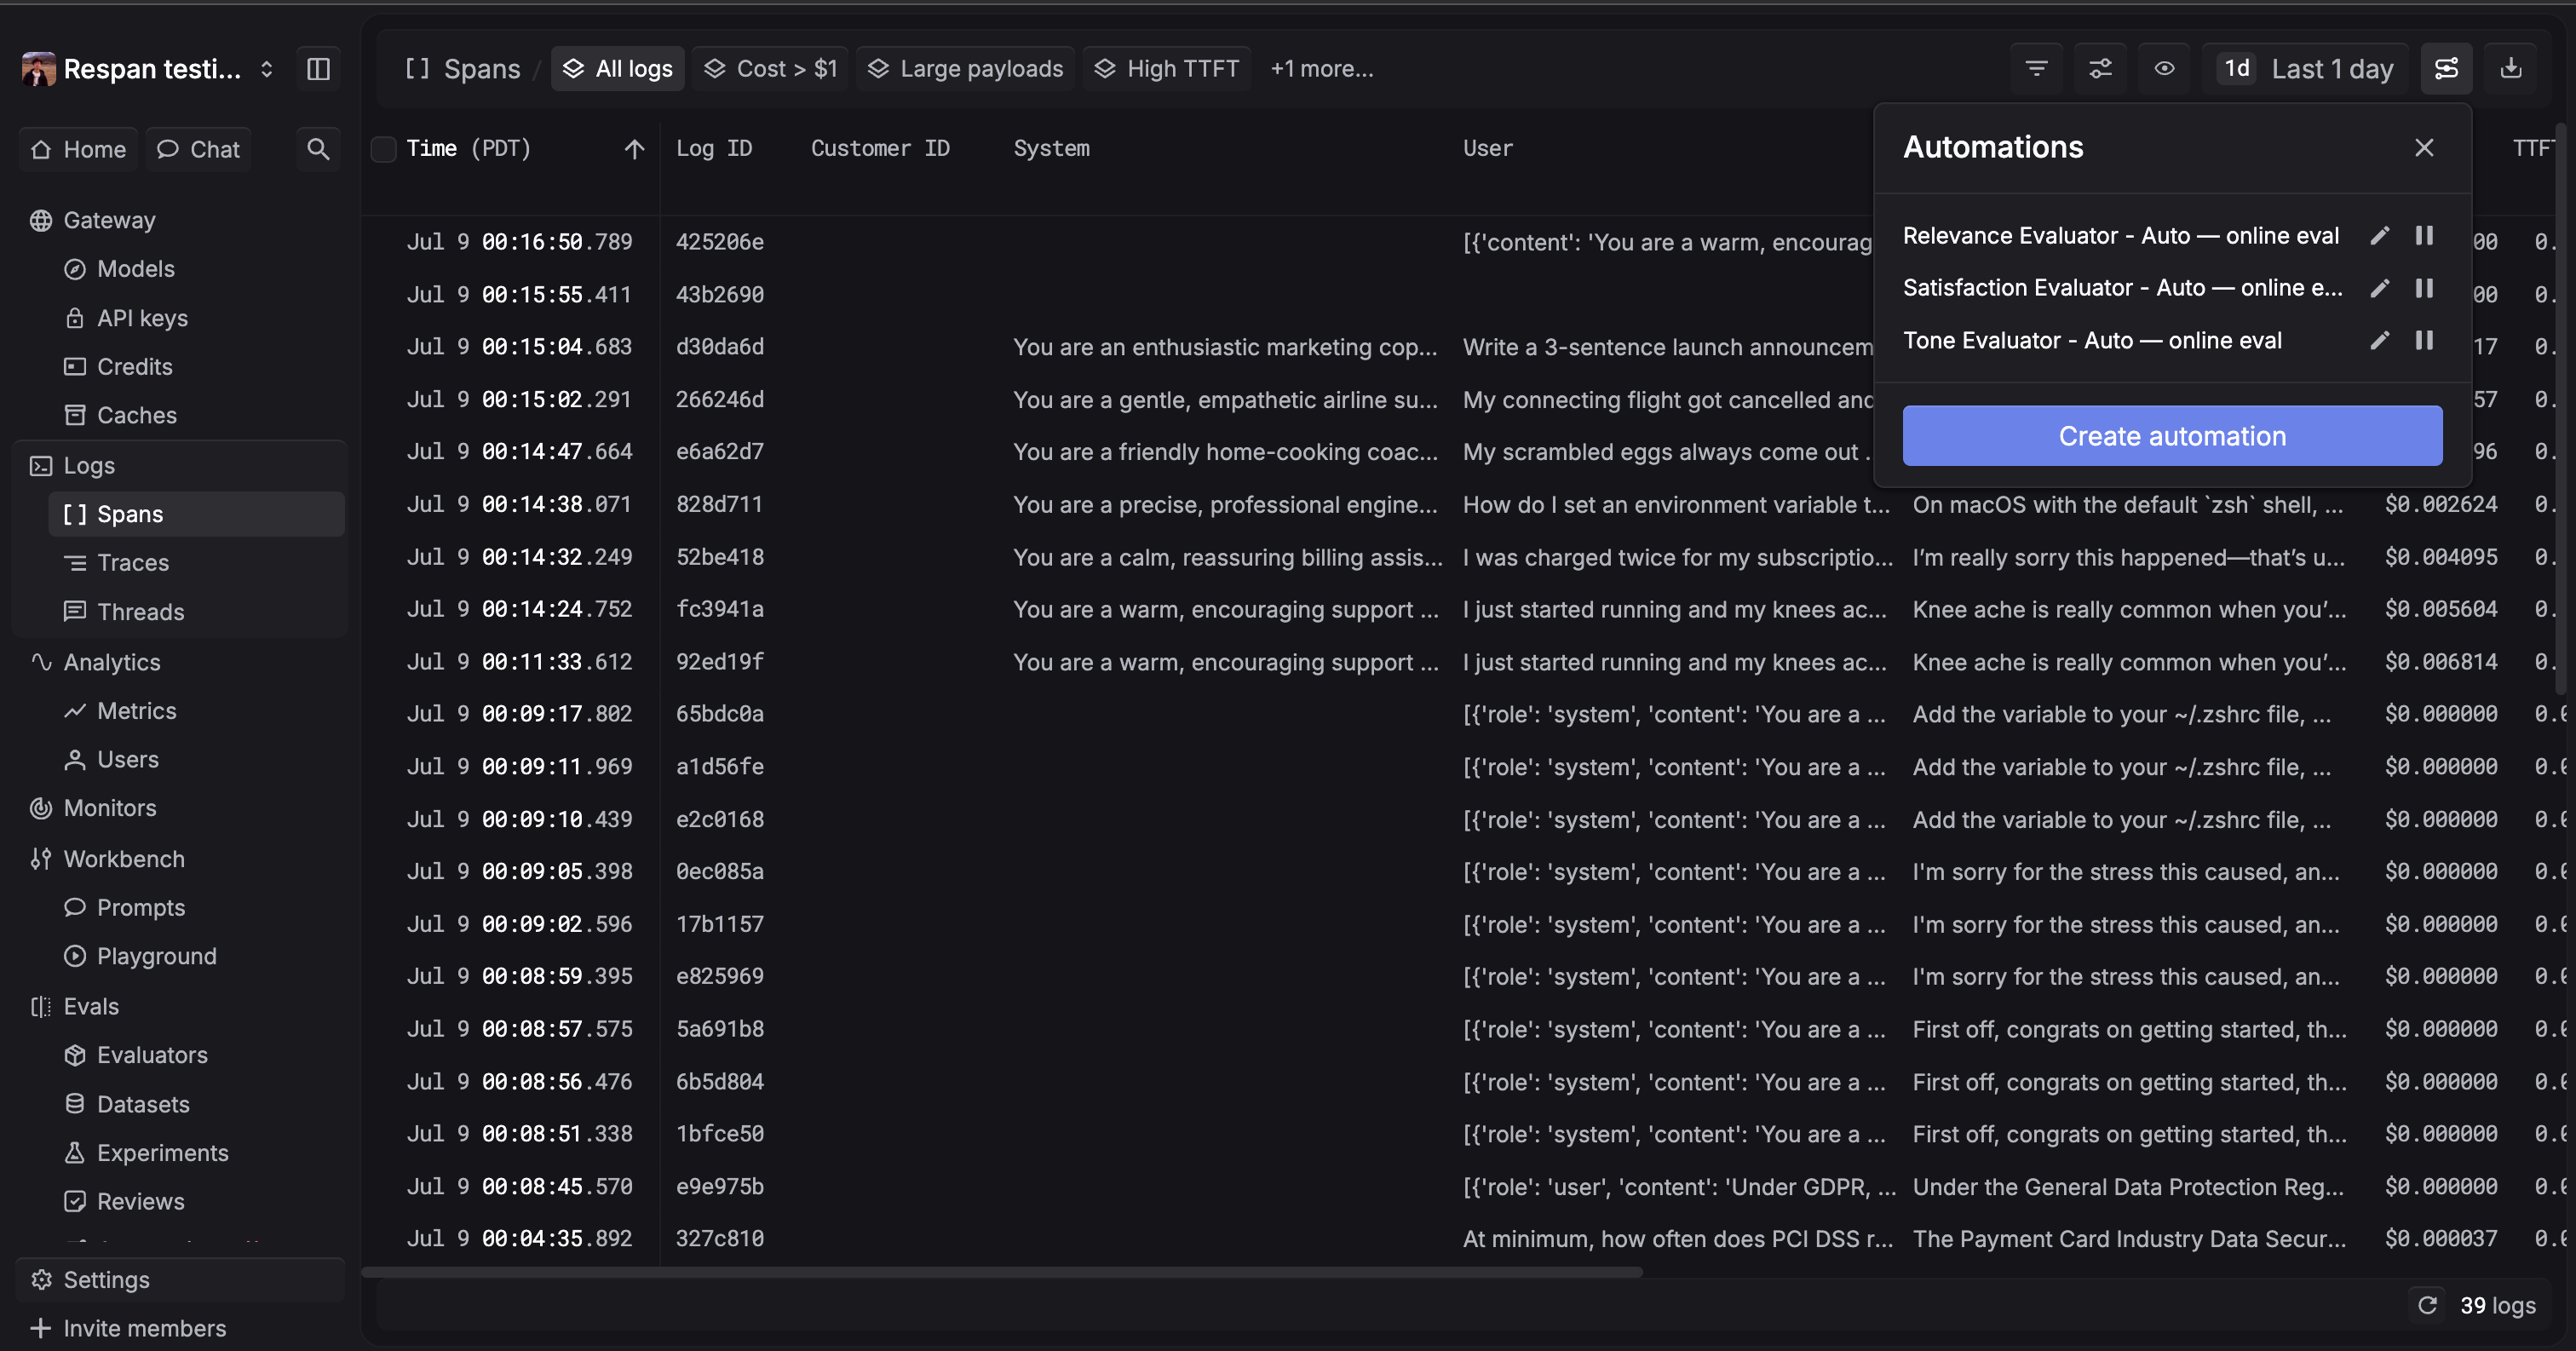
From the panel you can:
- Pause or resume an automation with the pause button. A paused automation stops scoring new spans until you resume it; a live/paused count at the top shows the current state of all your automations.
- Edit an automation with the pencil button. This opens the Configure automation dialog, which has the same evaluator, filters, and sampling rate controls as the create form; change any of them and click Update & redeploy to apply, or Pause the automation directly from this dialog.
- Create a new automation without leaving the Spans page.
Why pair online evals with the Gateway
Online evals grade the traffic that reaches Respan, so the value scales with how much of your application Respan can see. Routing model calls through the Gateway is the easiest way to get structured production spans: inputs, outputs, model, cost, latency, and status. Add tracing when Trace scope needs the complete multi-step execution. The automation can then sample and score the selected unit.
What’s next
Create and deploy the evaluator pipeline an automation runs.
Send your production calls through Respan so every span can be scored.
Understand scores, graders, evaluators, and online vs. offline evaluation.
Score a fixed dataset offline to compare prompts and models.