

Experiments
What is an experiment?
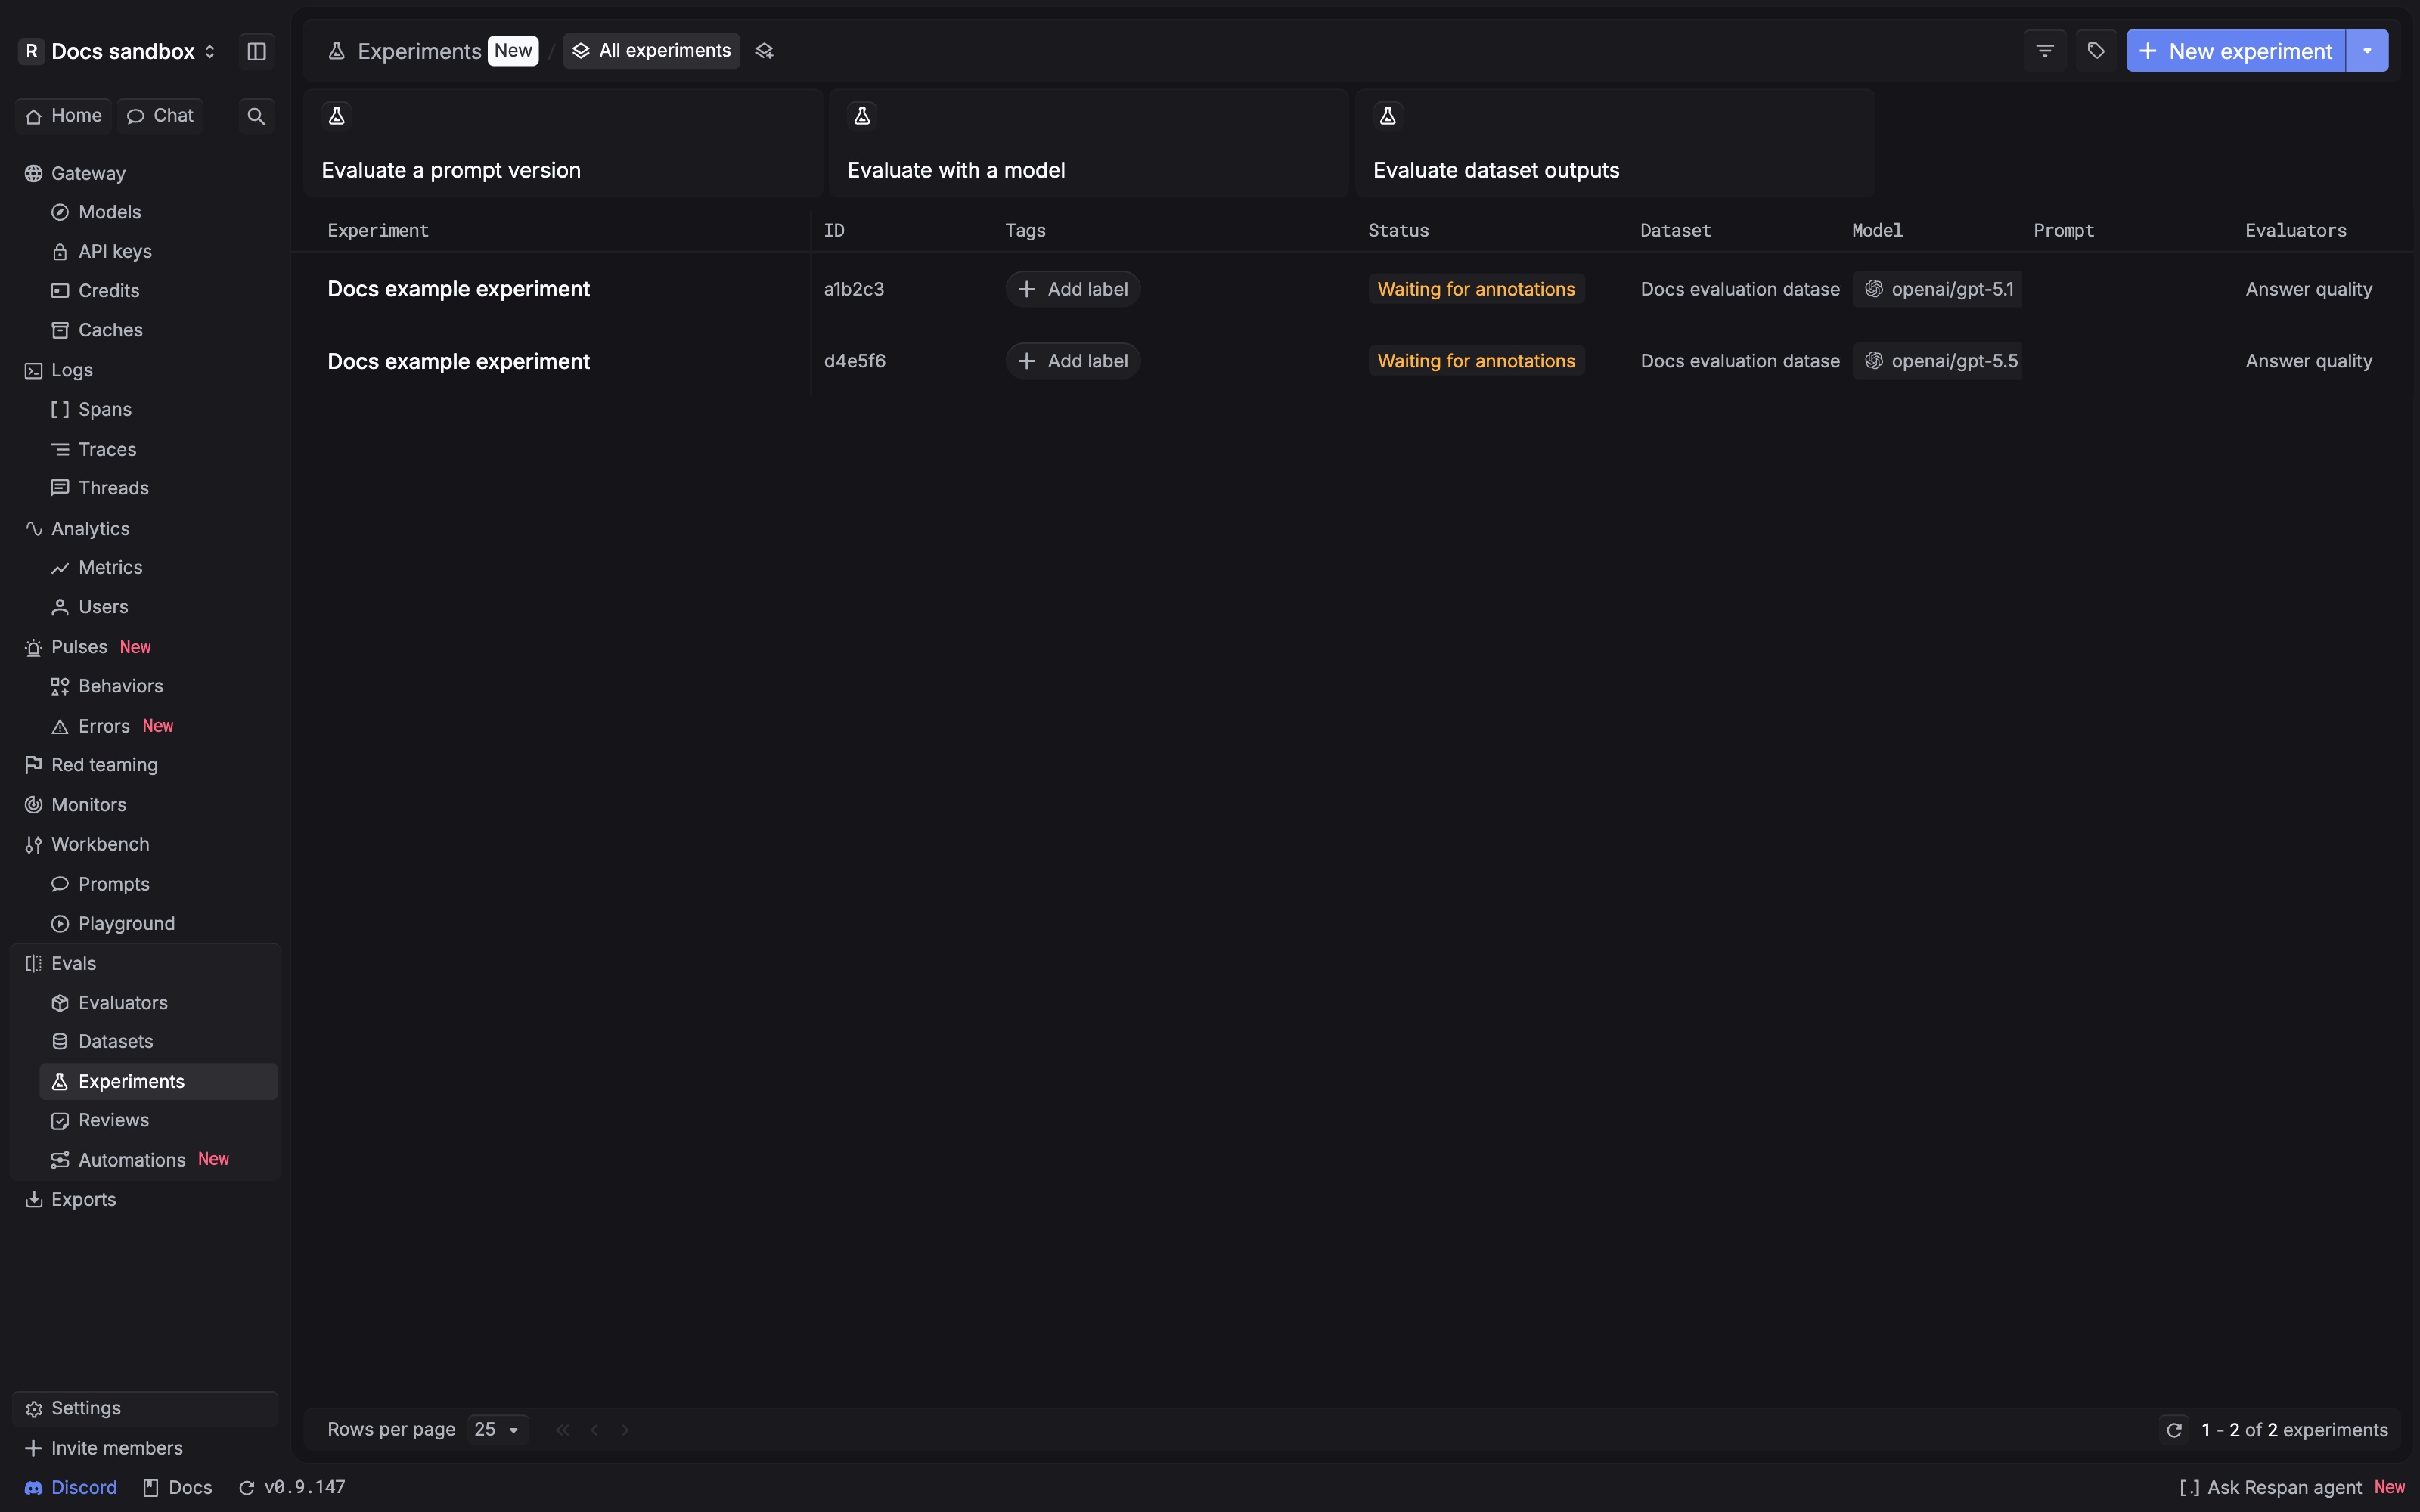
An experiment runs evaluations over a dataset and produces scores. It generates outputs by running every row in your dataset through a prompt or model, then runs the evaluator workflow over each output, and aggregates the results. Go to Experiments and click New experiment to get started.
The Experiments page also provides shortcuts for common starting points and a list of your existing runs.
Experiment types
When creating an experiment, you choose a task type that determines how outputs are generated. Pick the type that matches what you want to test.
Keep the dataset and evaluators unchanged when comparing prompt versions or models. Changing several inputs at once makes it harder to explain why scores moved.
Prompt
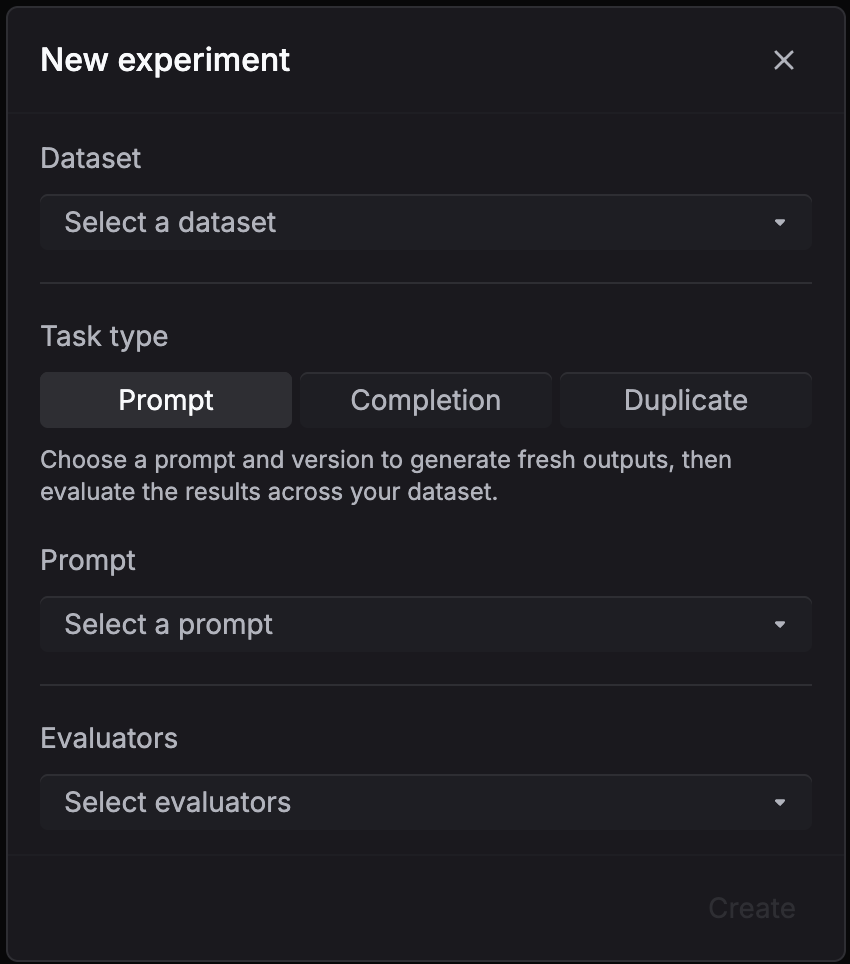
Use Prompt when you have a saved prompt template with variables like {{question}} and want to test how it performs across a dataset.
- Select your dataset, pick Prompt as the task type
- Choose the prompt and version to test
- Select evaluators to score the outputs
- Click Create
Respan fills the template with each row’s variables, generates an output for every row, and runs the evaluators on the results.
To compare prompt versions, create multiple experiments with the same dataset and evaluators but different prompt versions.
Model
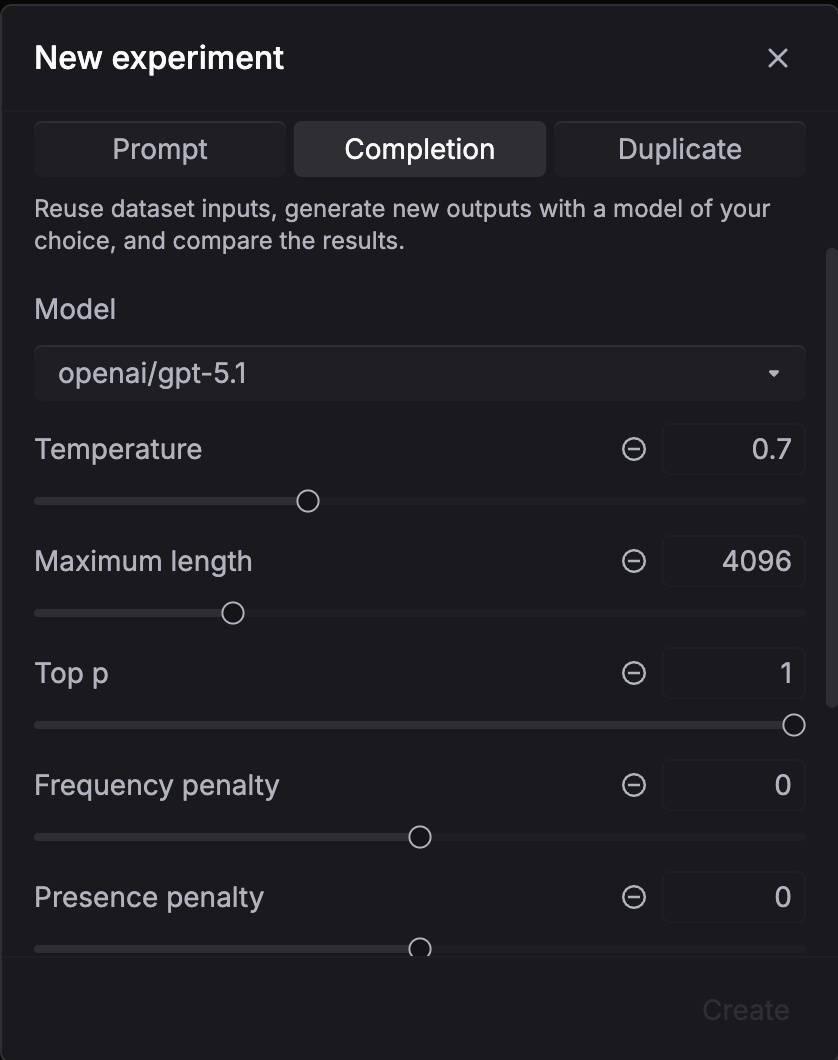
Use this when you want to compare models or generation settings. No prompt template needed.
- Select your dataset, pick Model as the task type
- Configure the model and generation settings (temperature, max tokens, etc.)
- Select evaluators to score the outputs
- Click Create
Respan sends each row’s input directly to the model, generates outputs, and runs the evaluators.
To compare models, create multiple experiments with the same dataset and evaluators but different model configurations.
Dataset outputs
Use this when your dataset already contains outputs and you only want to score them without calling a model.
- Select your dataset, pick Dataset outputs as the task type
- Select evaluators to score the existing outputs
- Click Create
No generation happens. Respan runs the evaluators directly on the outputs stored in your dataset.
Results and analytics
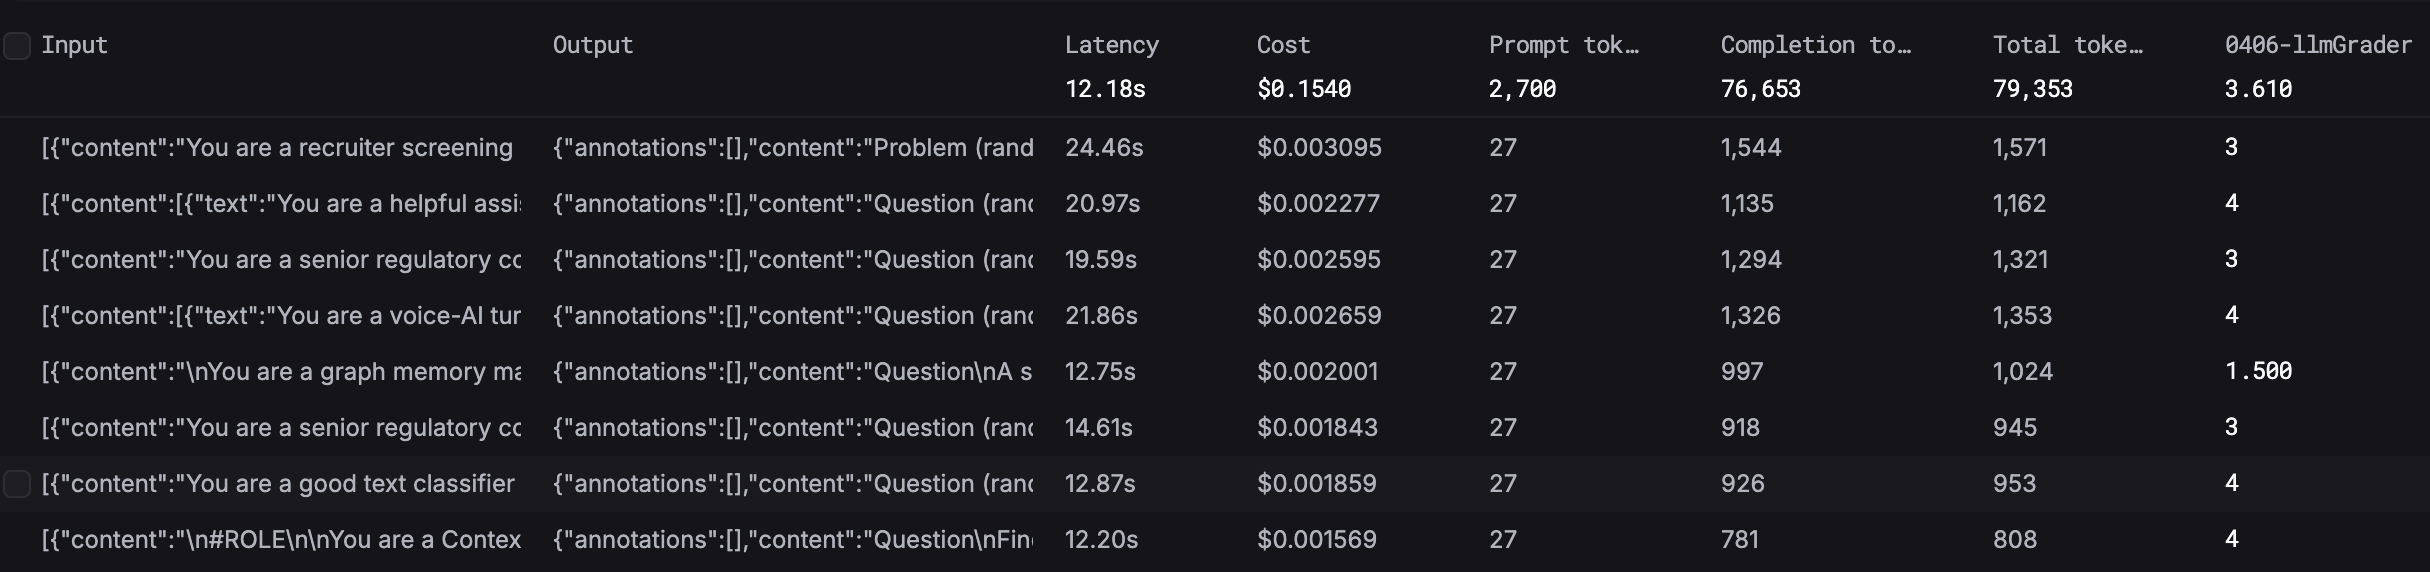
After an experiment finishes, inspect the generated outputs and evaluator scores per row.
The results table includes the dataset row ID, input, generated or stored output, expected output when present, latency, cost, and evaluator columns. Use the table controls to filter or adjust the result view before comparing runs.
Waiting for annotations
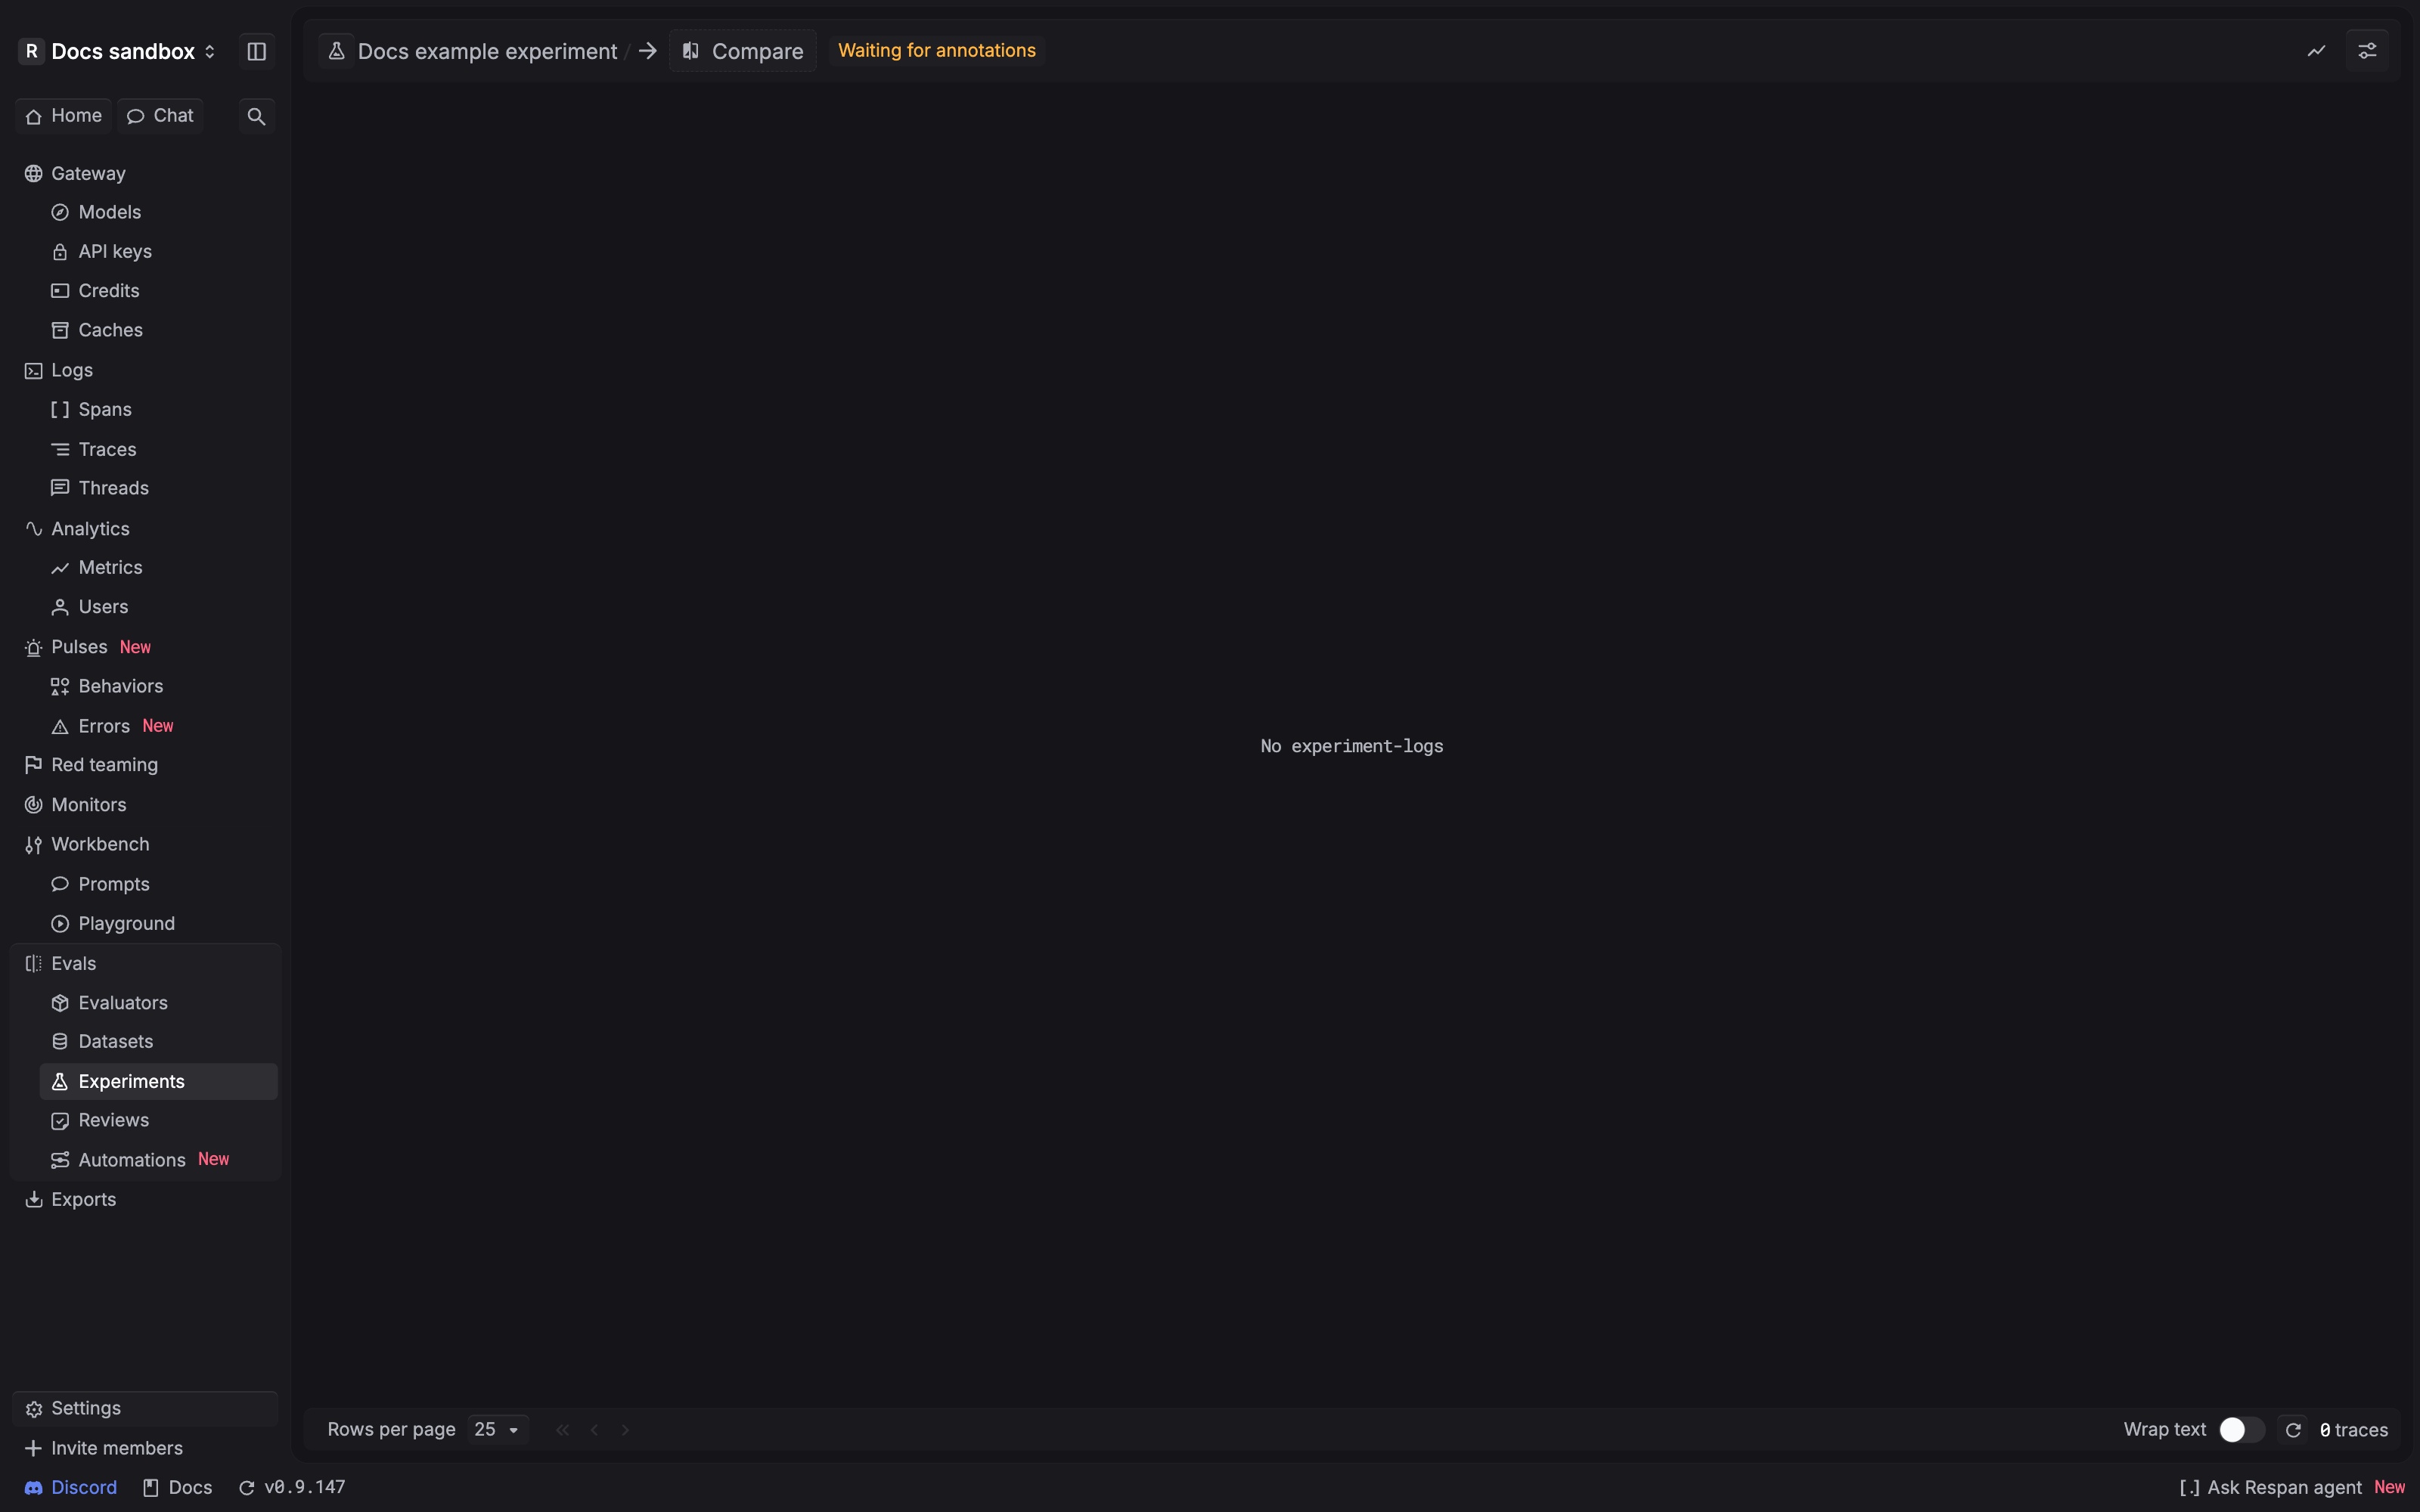
Waiting for annotations means the run still needs human grading for one or more configured annotation evaluators. Open the rows that need review, add the requested labels or scores, and return to the experiment after the annotation work is complete.
Automated evaluator results can appear without human review, but an experiment that requires annotations should not be treated as fully reviewed while this state remains.
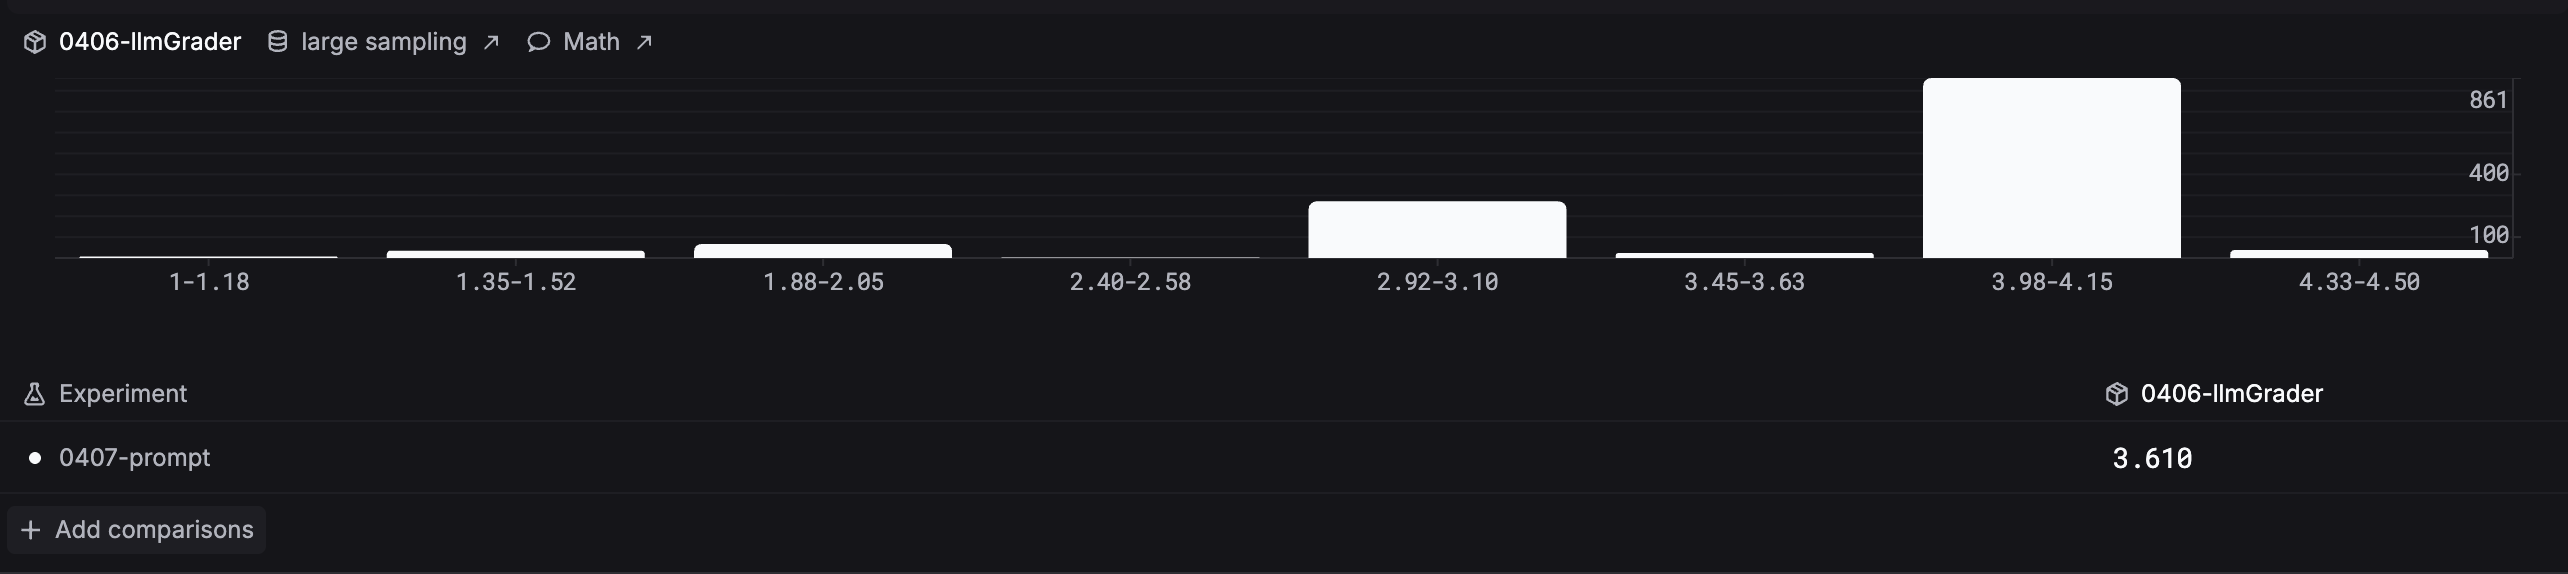
The Analytics tab compares evaluator score distributions across experiments. The histogram groups results into score ranges so you can spot patterns and compare runs side by side.
Compare and iterate
To improve your outputs, run multiple experiments and compare the results:
- Run your first experiment with the current prompt or model
- Review the scores and identify where outputs fall short
- Update your prompt version, switch models, or adjust settings
- Run a new experiment with the same dataset and evaluators
- Use the Analytics tab to compare score distributions across experiments and pick the best configuration
Repeat until you are satisfied with the quality, then deploy the winning prompt or model to production.
Troubleshooting
The run does not start
- Confirm that the selected dataset contains the variables required by the prompt or the
inputvalues required by a Model experiment. - Confirm that the selected prompt version exists and its variable names match the dataset columns.
- Confirm that the model is active in the model catalog and that its billing or provider credentials are configured.
Results are empty or incomplete
- Open the dataset and confirm that it contains rows.
- Check whether the experiment is still running or waiting for annotations.
- Review failed rows individually; one failed generation or evaluator should not be interpreted as a score of zero without inspecting the error.
Two runs are not comparable
Compare the dataset, prompt or model configuration, evaluator versions, and generation settings. A valid comparison changes the variable you intend to test while holding the rest of the setup constant.
For production scoring rather than a dataset run, use Online evals.