Tracing quickstart
Tracing captures every step of your AI app end-to-end (LLM calls, tool invocations, retrieval steps, and agent loops) so you can debug failures, track cost and latency, and review actual prompts and outputs. Respan auto-instruments 25+ frameworks through the SDK and visualizes each request as a nested trace tree on the platform.
Setup
1. Get your Respan API key
Create an account on Respan, then generate a key on the API keys page.
Environment management: create separate API keys for test and production instead of toggling an env parameter. Cleaner separation, better security.
2. Instrument your app
Wire the Respan SDK into your project. Pick the path that fits your workflow.
AI (CLI)
Manually
The fastest way. The Respan CLI hands off to your coding agent (Claude Code, Cursor, Codex, and others), which detects your project language, installs the SDK, and instruments your code.
It also creates a Respan API key for you and prints an export RESPAN_API_KEY=<key> command to run in your shell if one isn’t already set.
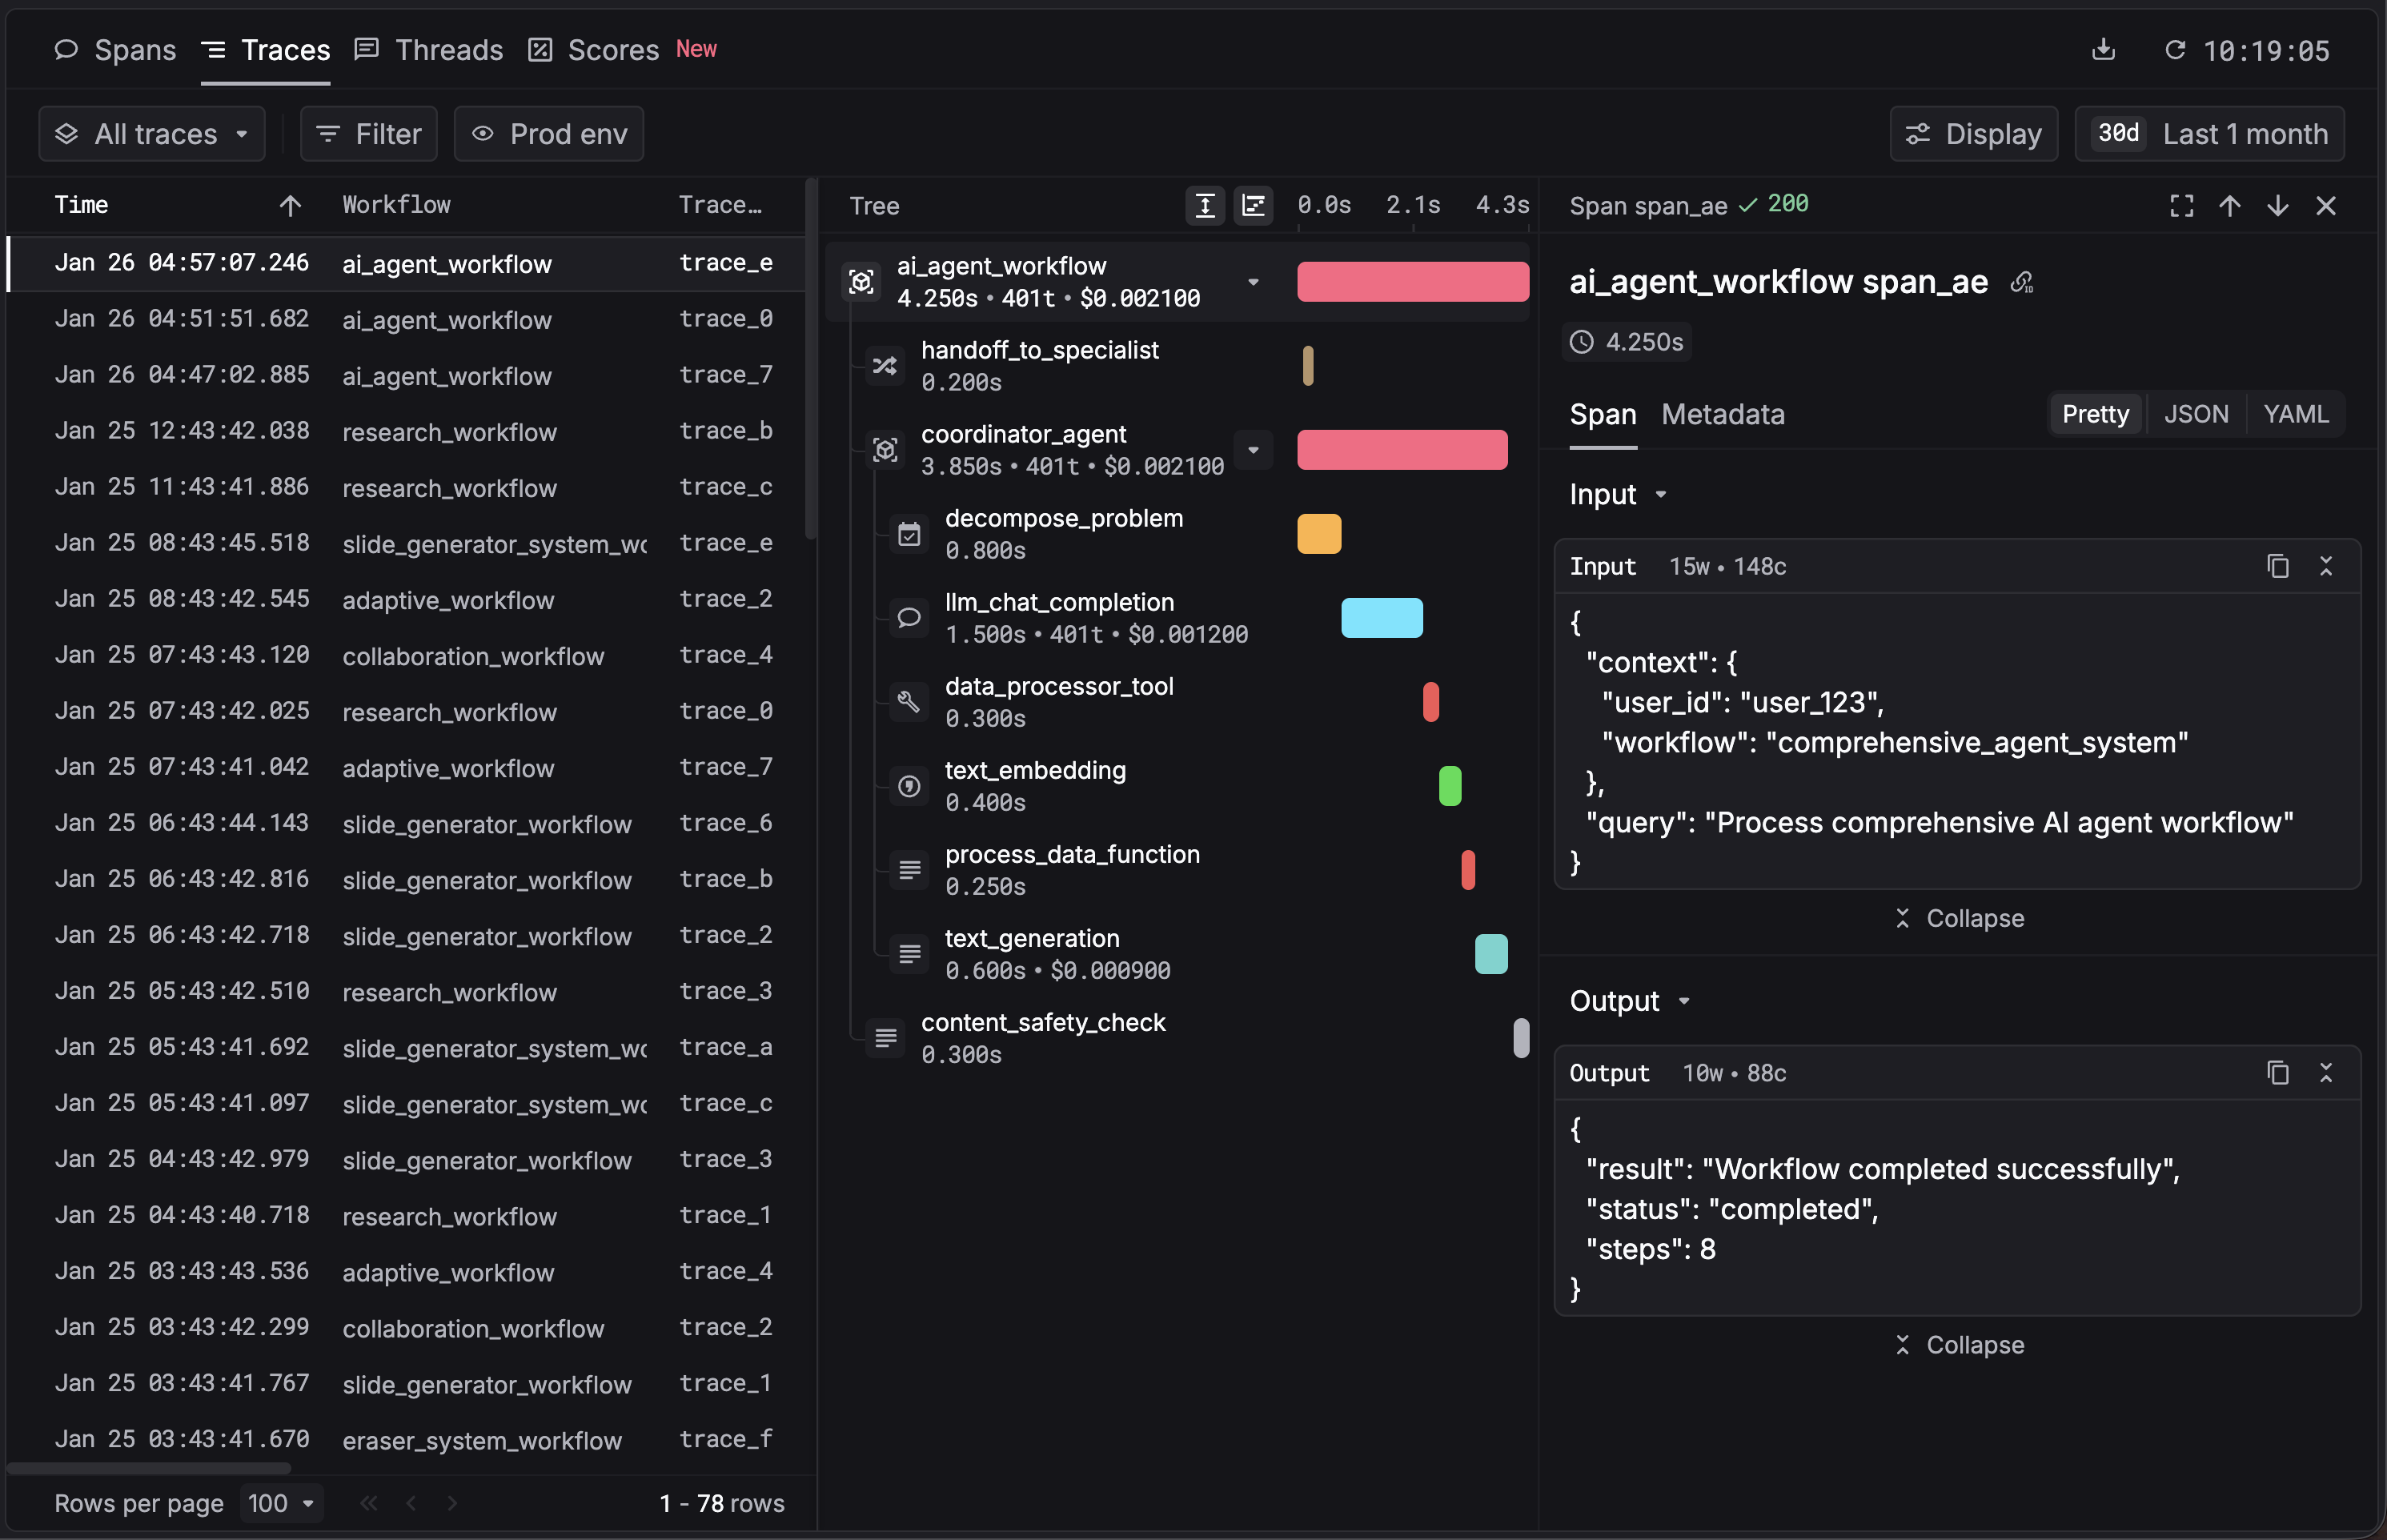
3. View traces
Once instrumented, your app logs traces to Respan for every AI call. Open the dashboard to see them.
Or try it live without installing anything.
Next steps
You’re tracing your app. Here’s what else Respan tracing gives you.
What tracing provides
- Auto-instrument 25+ frameworks OpenAI, Anthropic, Bedrock, Vertex, agent frameworks (OpenAI Agents, Claude Agents, Vercel AI, Pydantic AI, LangChain, LlamaIndex, CrewAI), and more, with one SDK call.
- Custom spans with decorators
@workflowand@taskgroup related calls into a single trace tree. - Override span fields Patch model names, costs, or inputs/outputs on captured spans.
- Metadata & tags Tag traces with
customer_identifier,metadata, and custom attributes for filtering and breakdowns. - Multimodal span types Capture text, images, audio, video, PDFs, and thinking blocks.
- Manual span logging Log spans directly from any language via API or OTel/OTLP.
- OpenTelemetry compatible Already on OTel? Export spans to Respan with your existing exporter.
- Retention & export Control how long traces stay searchable and export them to your warehouse.
Examples
- Trace a CLI coding agent Capture Claude Code, Codex, Gemini CLI, and OpenCode runs.
- Trace a RAG pipeline Embeddings, retrieval, and generation in one trace tree.
- All integrations Every supported framework, LLM provider, and tracing client.