This is Day 1 of Respan Launch Week.
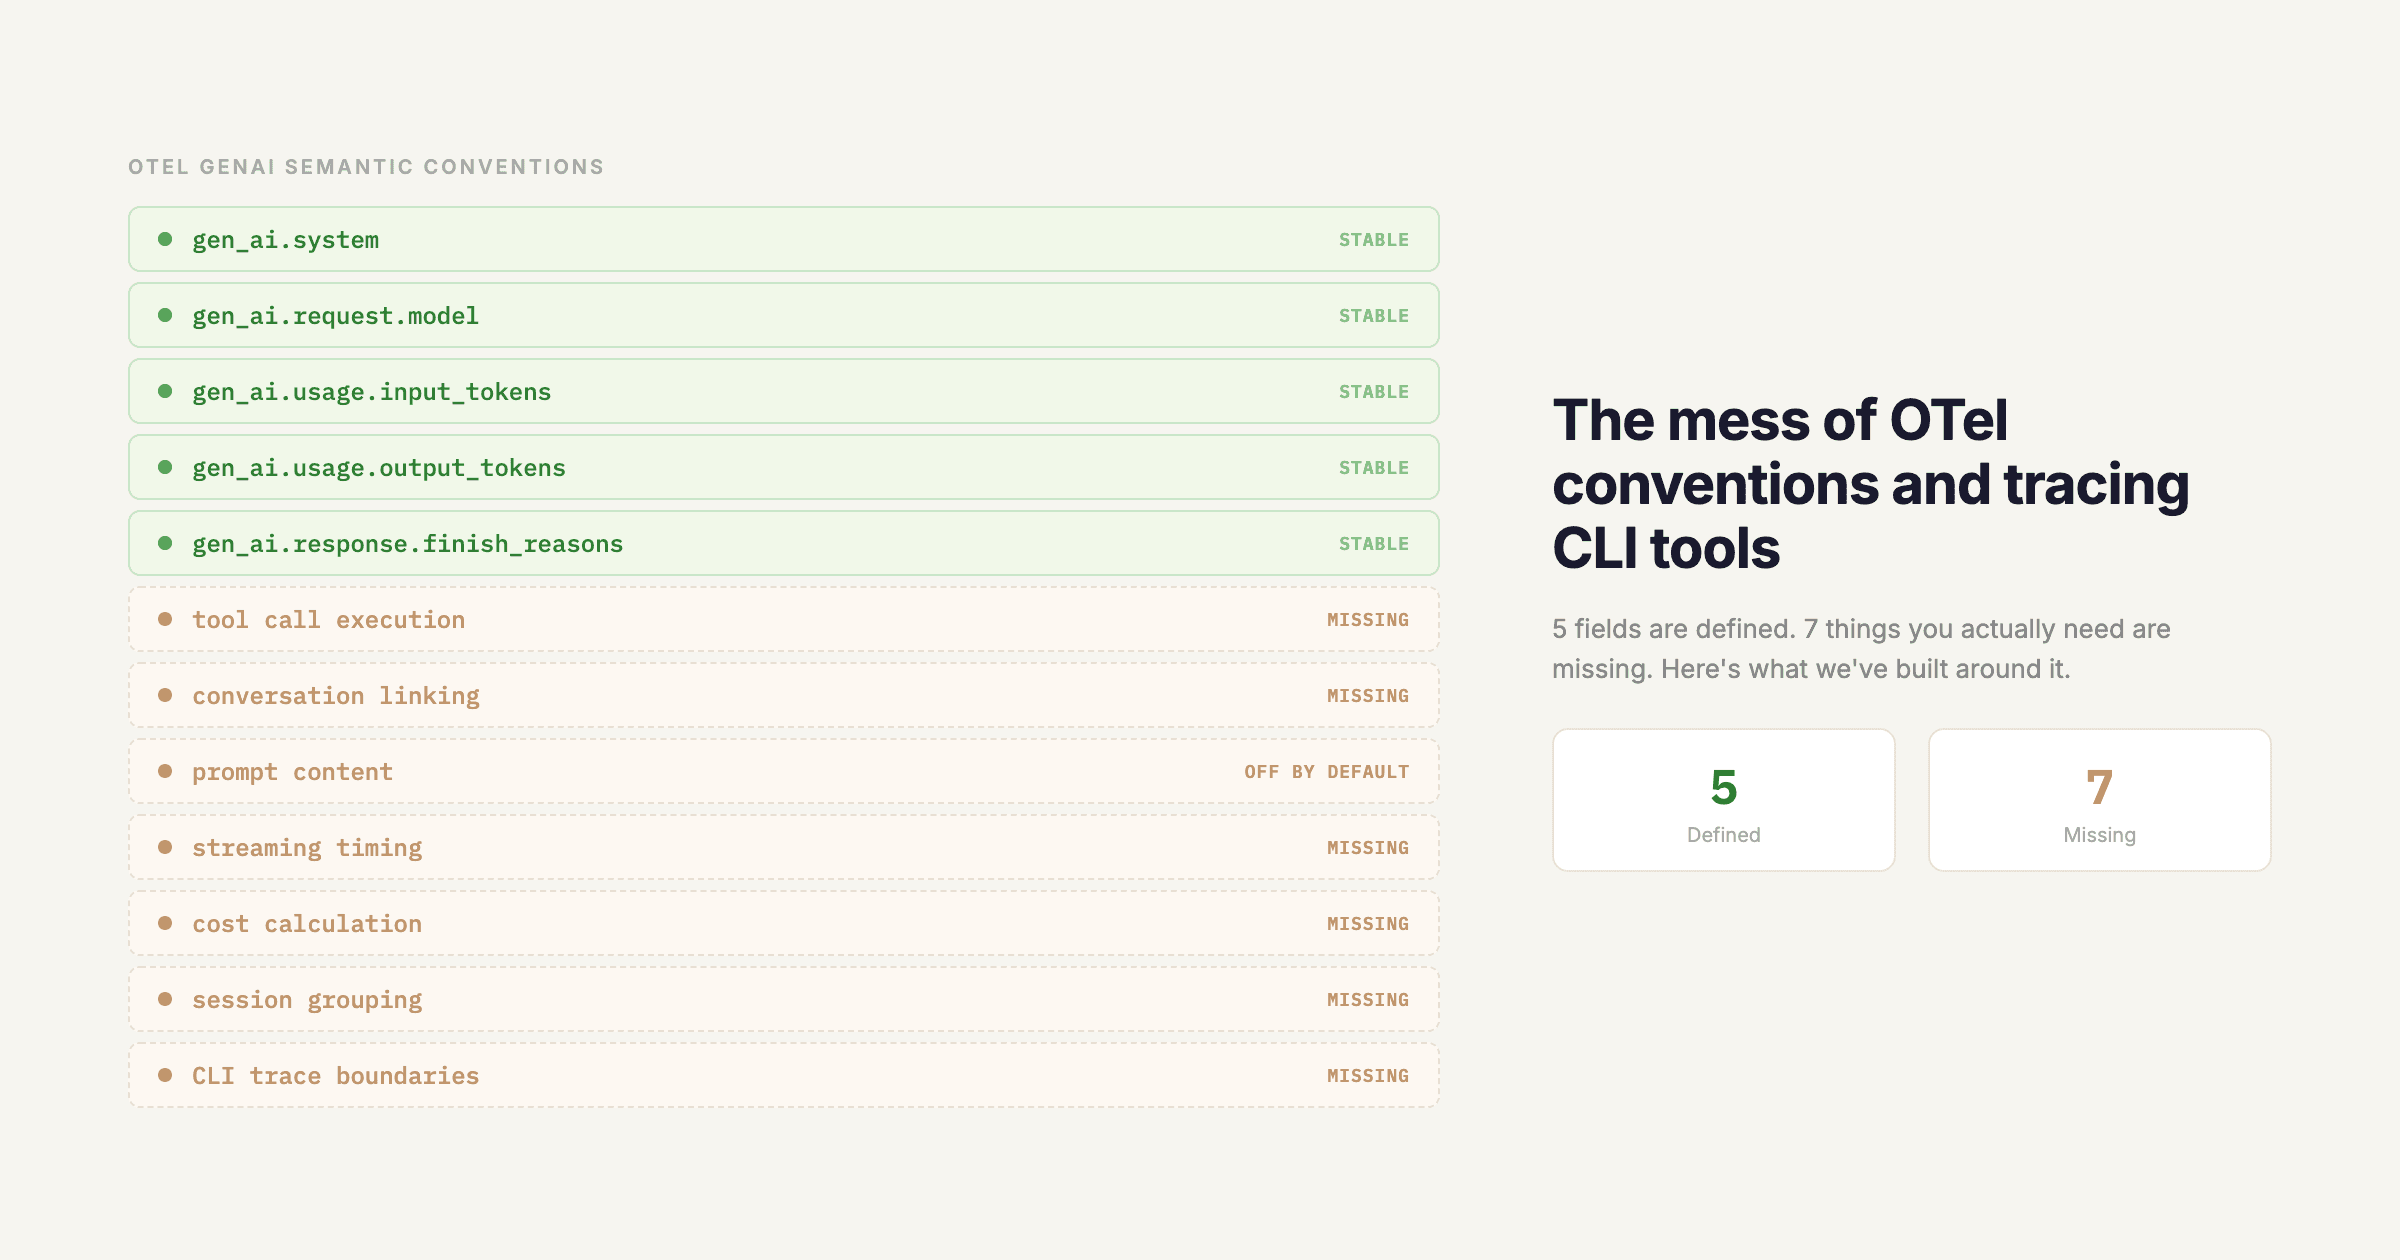
Your LLM app works great in dev. Then you deploy, and a model update quietly doubles your error rate. A prompt change triples your token usage. Latency creeps up. You find out from a customer complaint.
Today we're launching Monitors so you find out first.
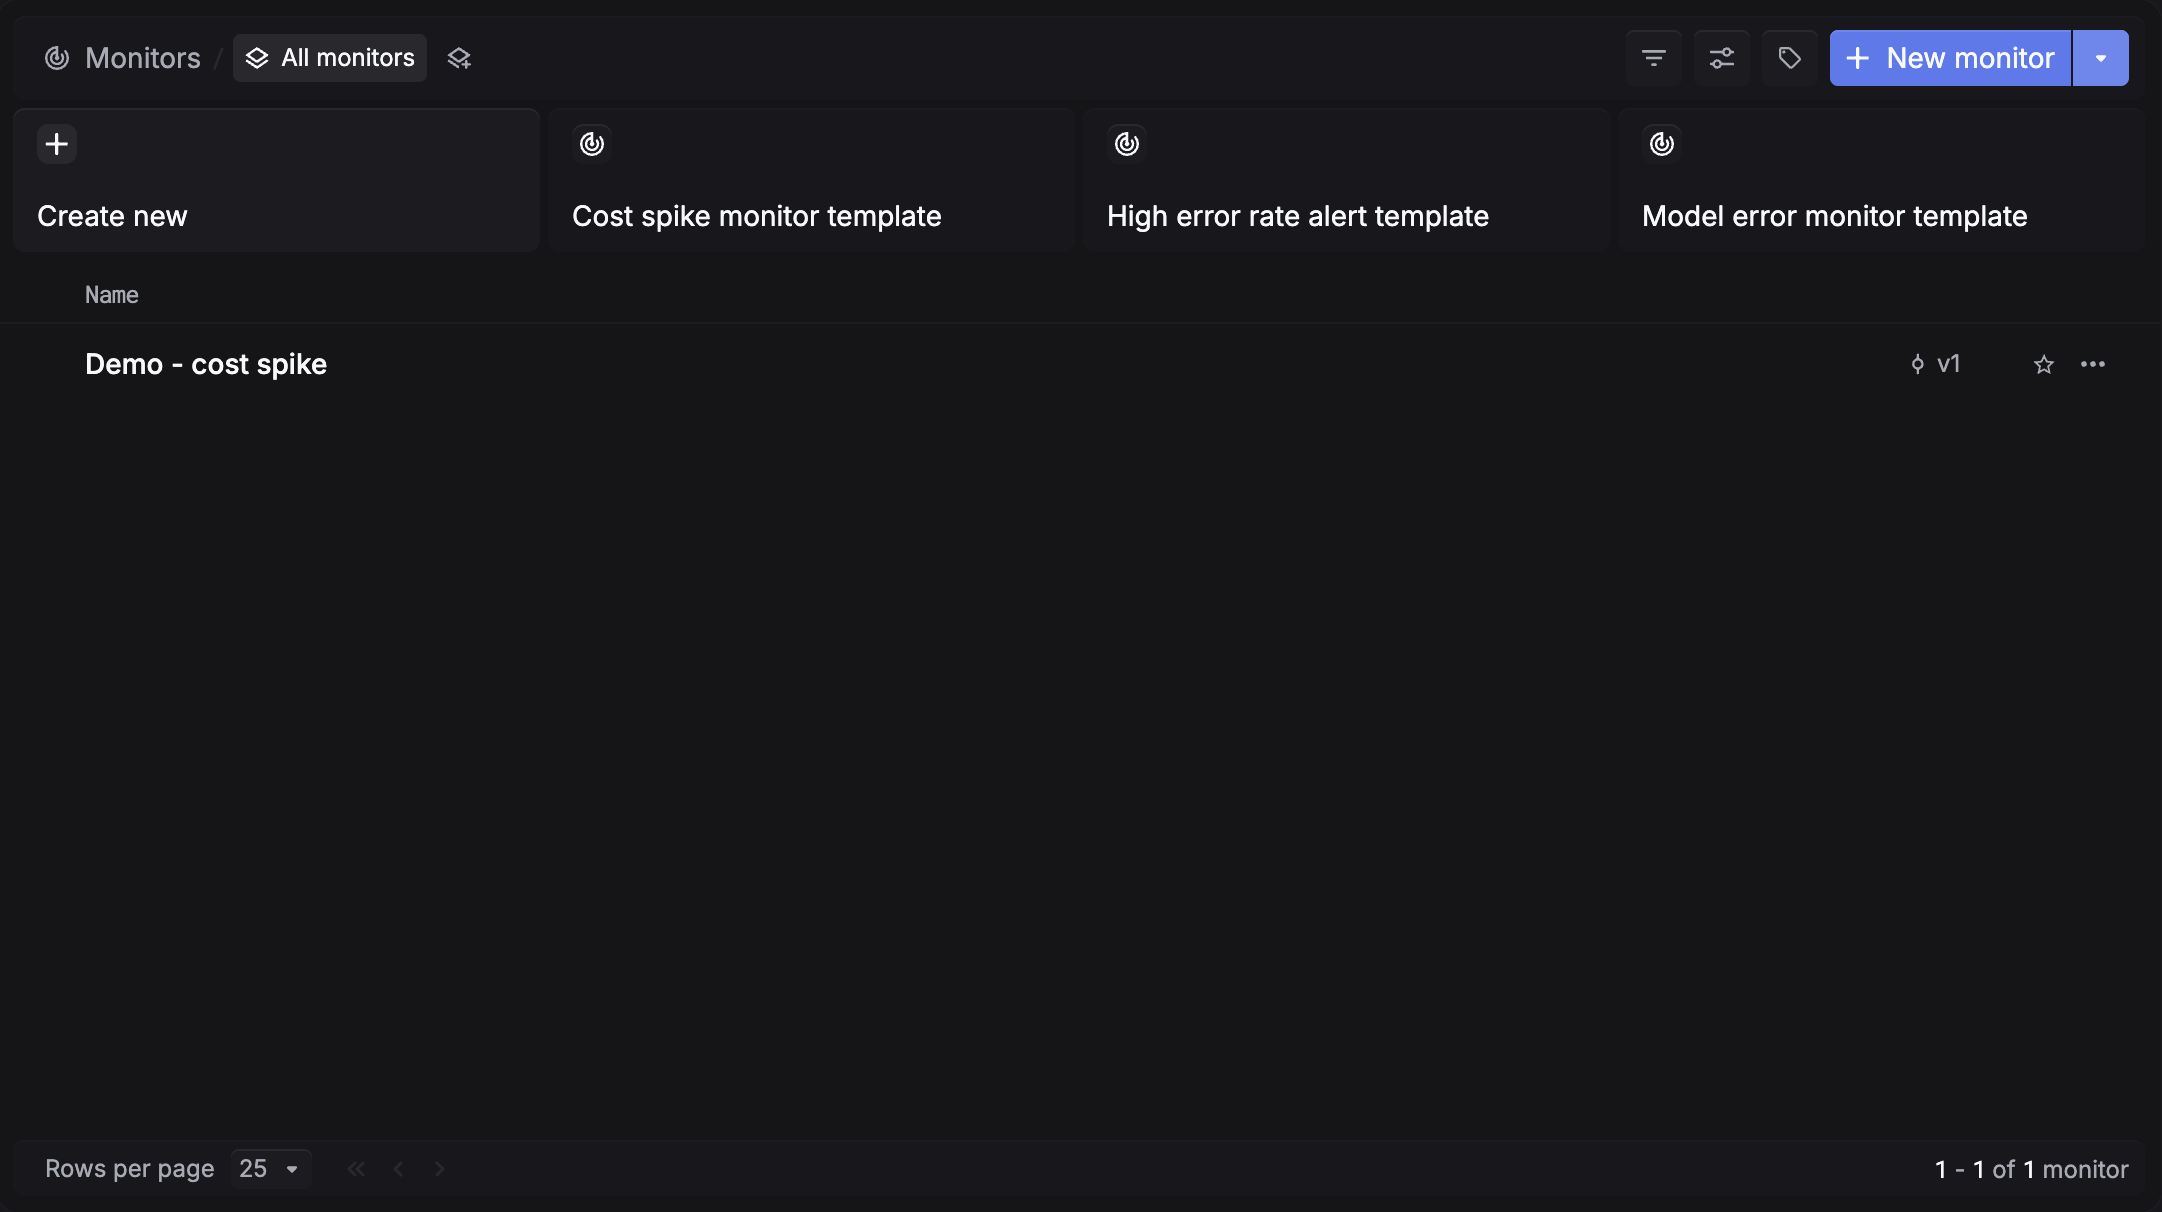
Start from a template
We've prepared presets for the most common failure modes: cost spikes, high error rates, and model errors. Pick one and deploy in under a minute, or create your own from scratch.
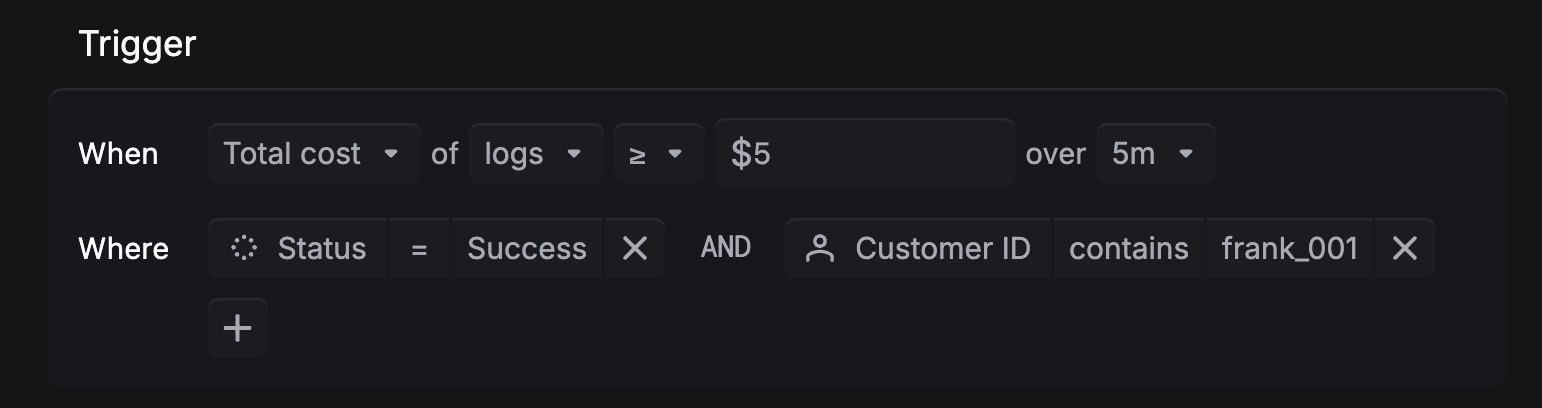
Define your alert condition
Monitor error rate spikes, cost overruns, latency regressions, and token usage. Set the threshold and time window, then add filters to scope it to a specific model, project, environment, or customer.
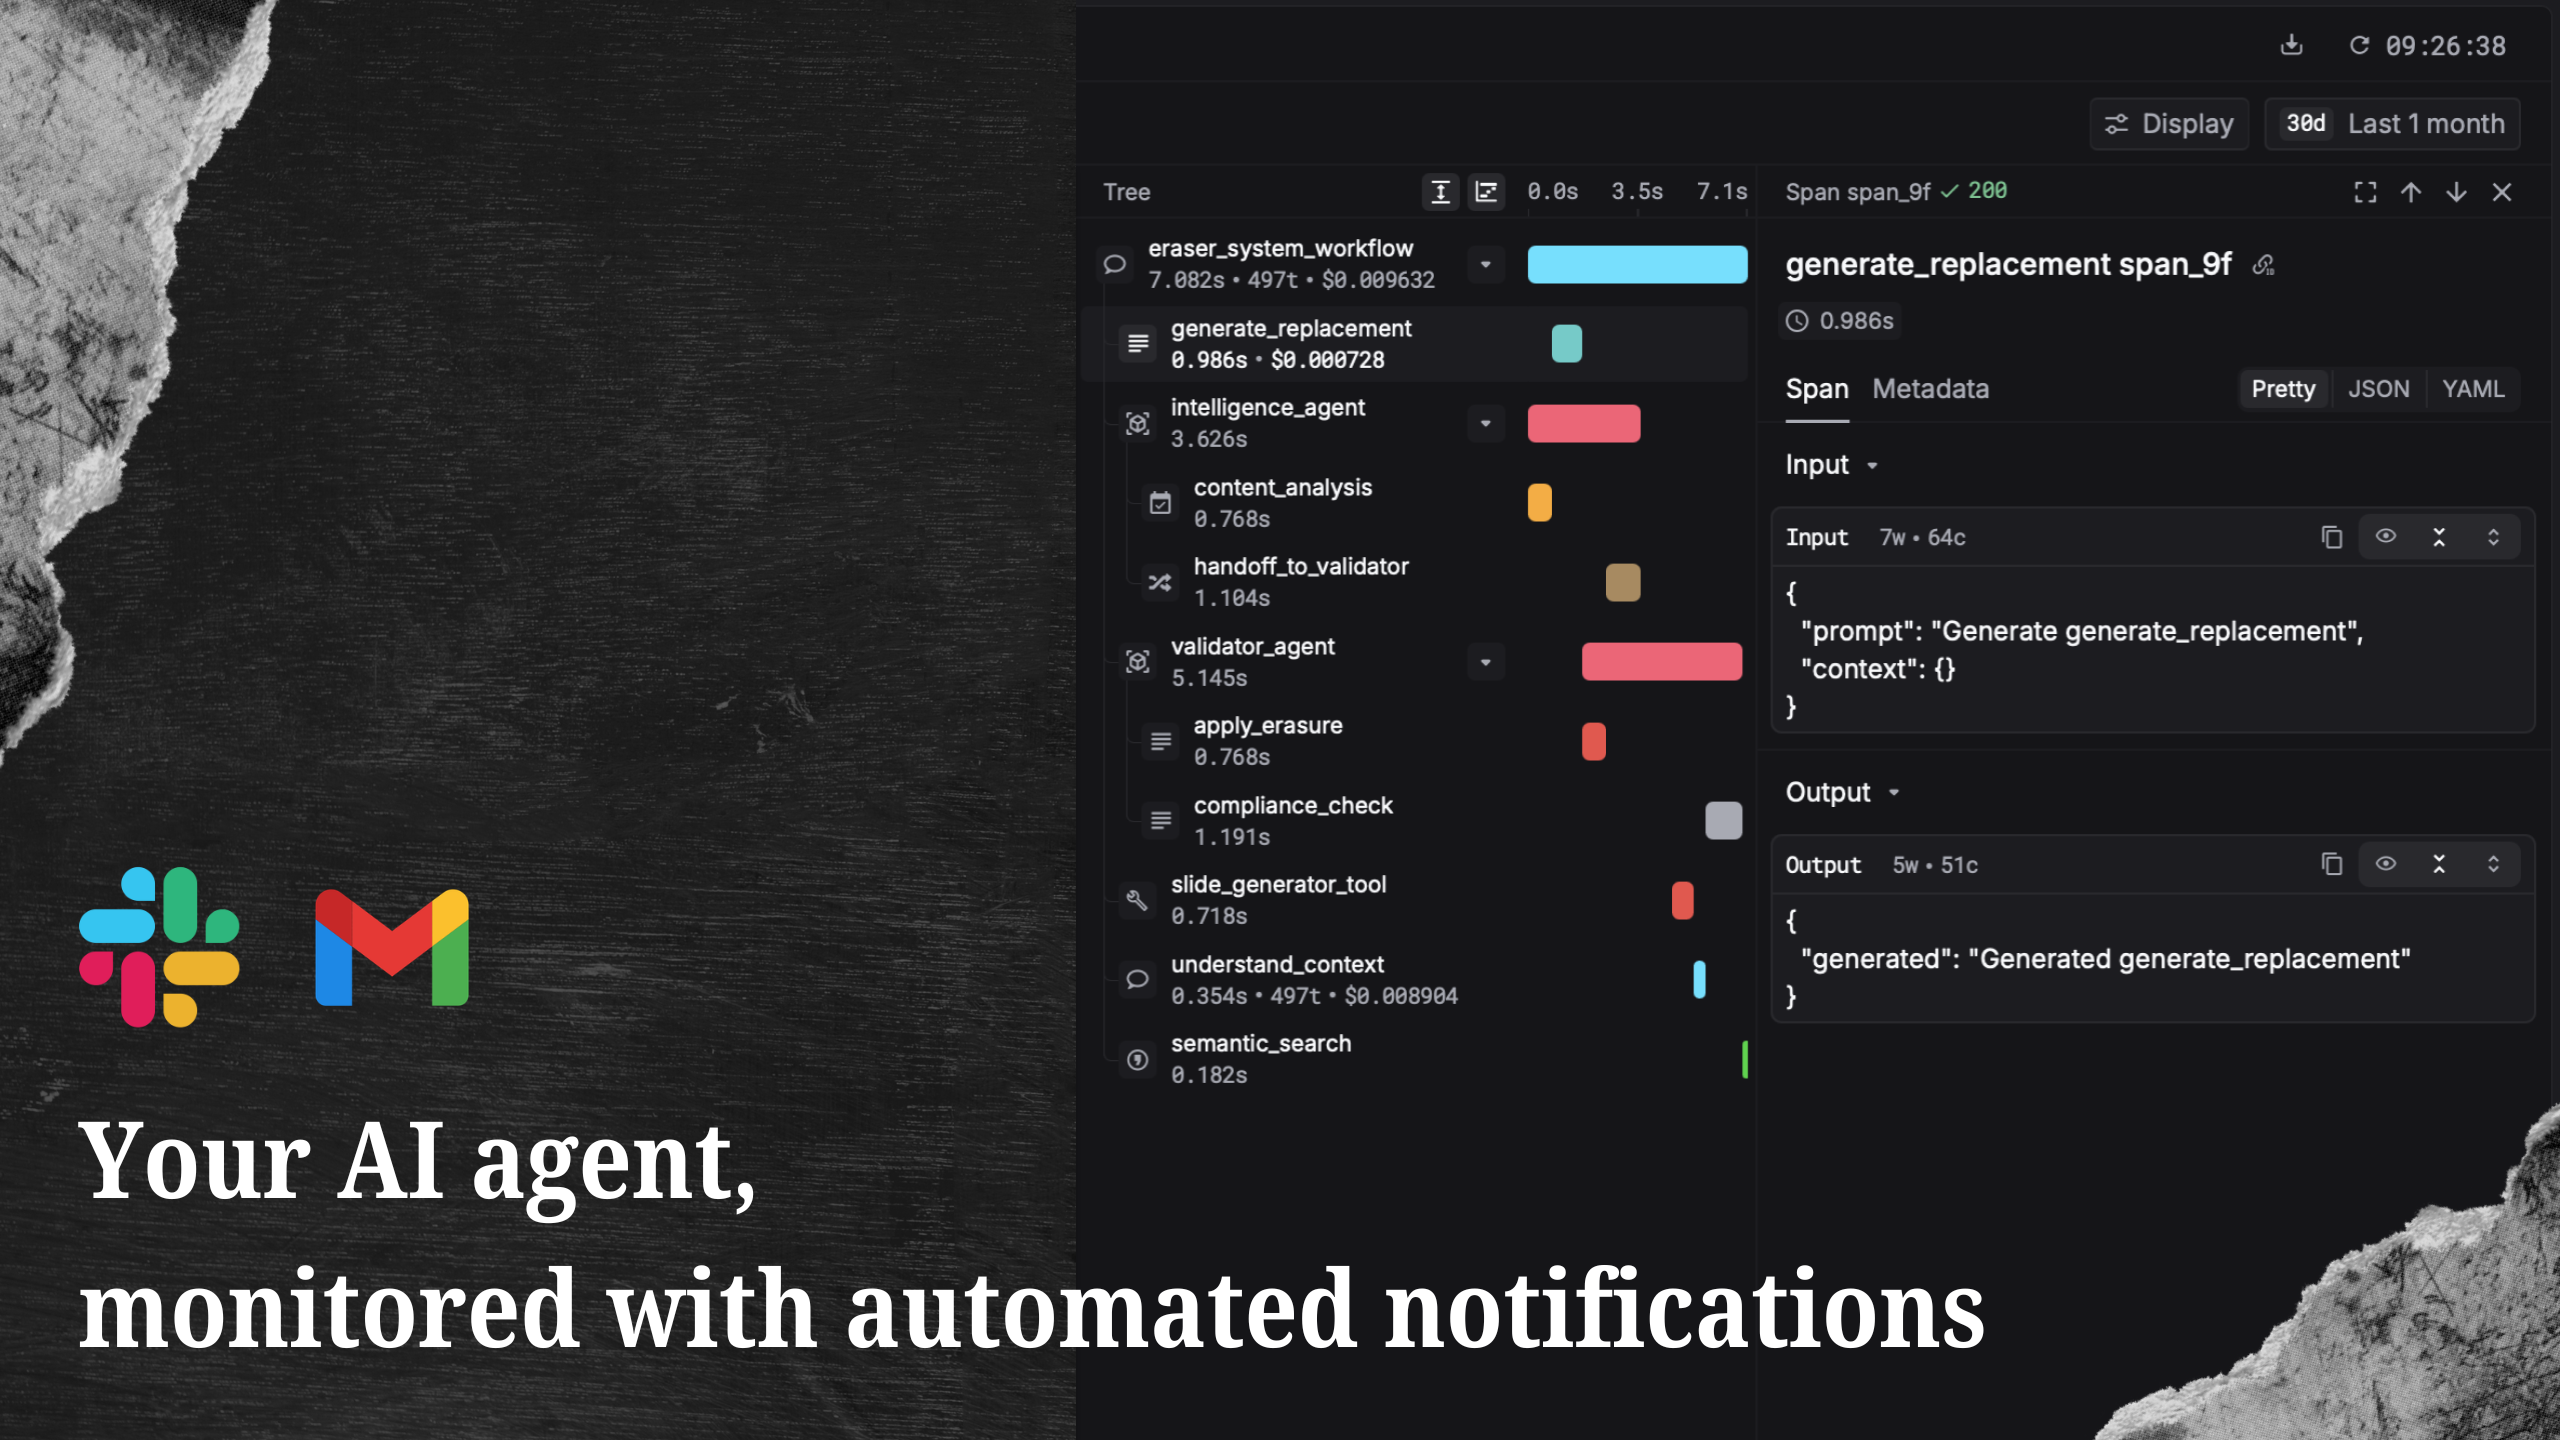
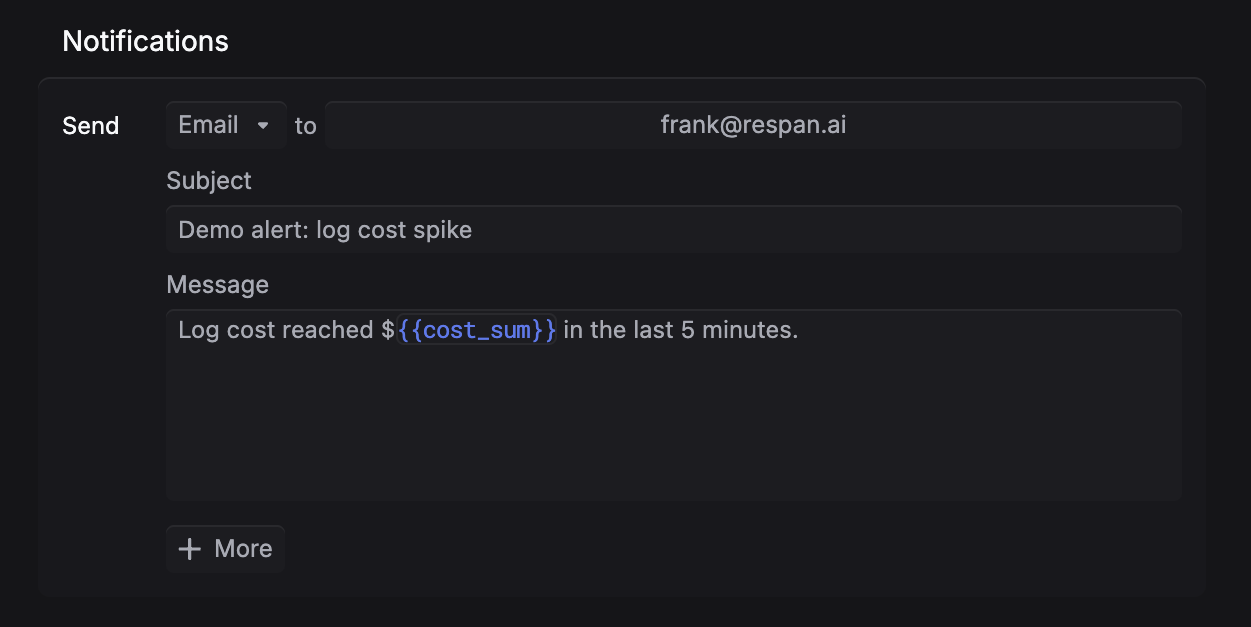
Get notified where you already work
Alerts go to Slack, email, or webhook. A single monitor can notify multiple destinations. Test the alert before deploying.
Monitors are available now. Go to platform.respan.ai/platform/monitors to set up your first alert.
Not on Respan yet? Get started in under 5 minutes:
npx @respan/cli setupTo stay updated for the rest of Launch Week, follow us on X or join our Discord community!