Everyone has opinions about Claude Code vs Codex. Most of them are based on vibes: which one "feels" smarter, which one finishes faster, which one wrote the better React component that one time.
We wanted something more concrete. So we instrumented both tools with tracing, ran them through the same set of tasks, and looked at what actually happened inside each session. Not the final output. The full execution trace: every LLM call, every tool invocation, every retry, every token.
The result is a side-by-side comparison that's less about "which is better" and more about "how are they different," because the differences are architectural, and they matter for different kinds of work.
The setup
We used Respan's OpenTelemetry SDK to capture traces from both tools across 30 tasks spanning five categories: greenfield feature implementation, bug fixing in existing codebases, refactoring, test writing, and multi-file changes. Each task was run three times per tool to control for variance.
For each trace, we captured:
- Every LLM call (model, prompt tokens, completion tokens, latency)
- Every tool call (file reads, writes, shell commands, searches)
- The full conversation thread between the agent and the model
- Error events and recovery patterns
- Total cost and wall-clock time
Both tools were configured with their default settings. No custom system prompts, no workflow files, no special flags. Just point at a repo and give the same natural language instruction.
Planning: upfront vs emergent
The first thing you notice in the traces is how differently these tools approach planning.
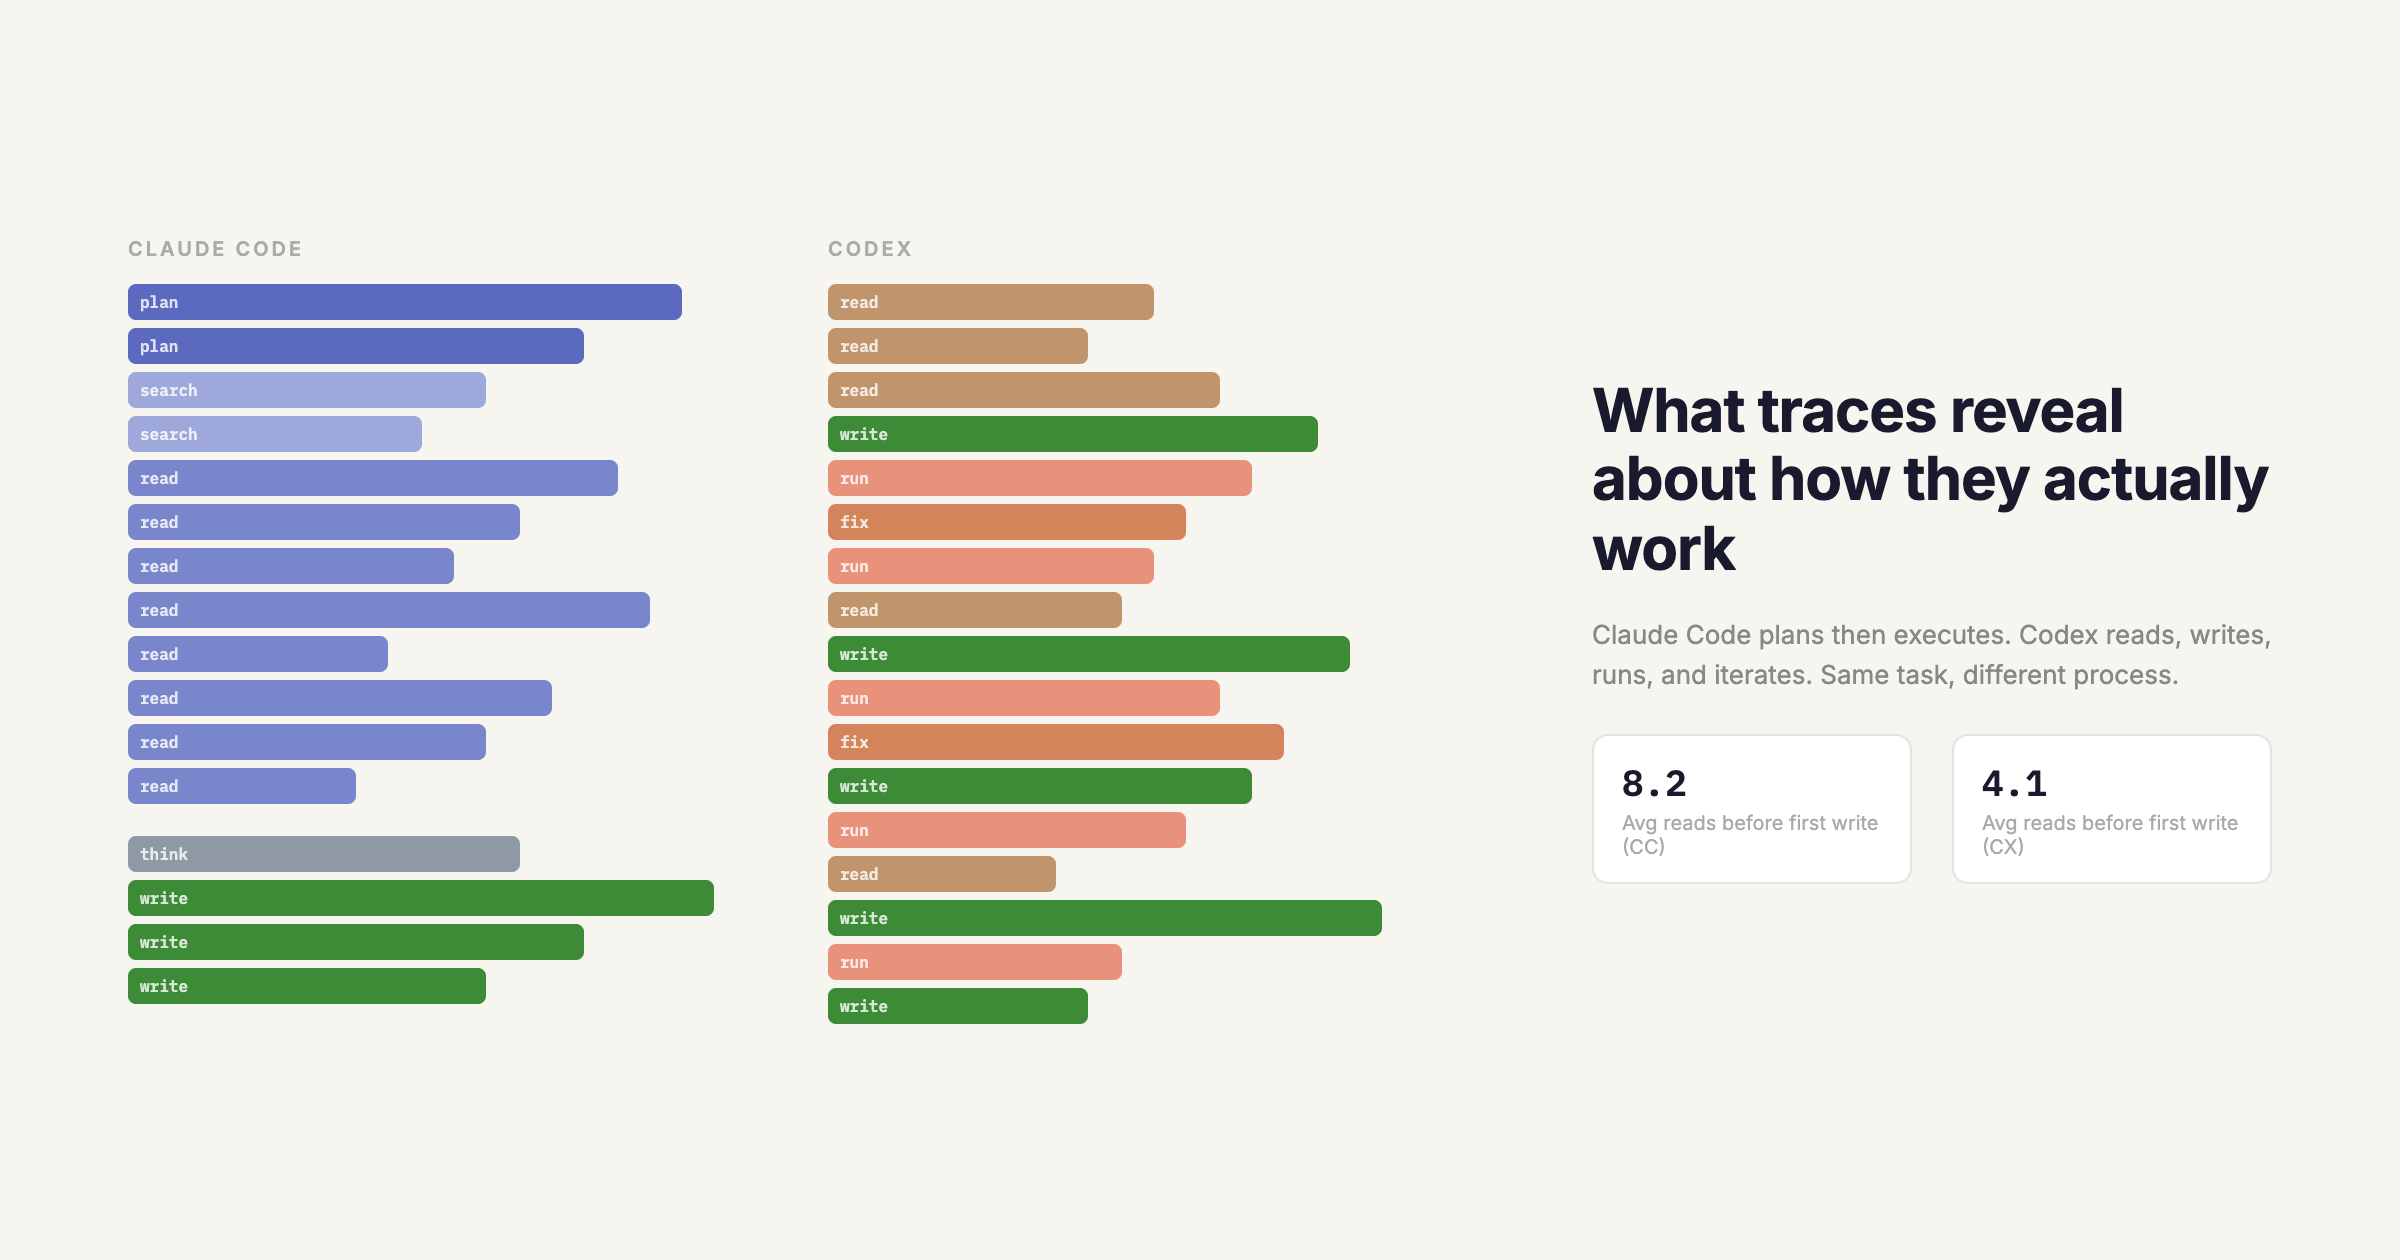
Claude Code front-loads its thinking. On a typical multi-file feature task, the trace shows an initial planning phase, often 2,000 to 4,000 tokens of reasoning before the first file read. It maps out which files it needs to touch, what order to work in, and what the dependencies are. Then it executes roughly in that order, reading files it identified in the plan.
Codex is more reactive. It reads a file, makes a change, reads the next file, adjusts. The traces show a tighter loop between reading and writing, with less upfront reasoning. On simple tasks, this is faster because there's less overhead before the first edit appears. On complex multi-file tasks, it sometimes leads to backtracking when Codex discovers a dependency it didn't anticipate.
The trace data shows this quantitatively: Claude Code's median "time to first edit" is 12 seconds longer than Codex's, but its median "number of revisions to the same file" is 40% lower. It thinks more, backtracks less.
Tool calling patterns
Both agents have access to similar tools: file read, file write, shell execution, and search. But the traces reveal very different usage patterns.
File reads. Claude Code reads more files before making changes. Across our task set, it averaged 8.2 file reads before the first write, compared to Codex's 4.1. On refactoring tasks specifically, Claude Code read an average of 14 files before writing; Codex read 6. Claude Code's reads also tend to target more peripheral files (test files, config files, type definitions) that inform its plan but aren't directly edited.
Shell commands. Codex runs more shell commands mid-task. It's more likely to run the code, check the output, and iterate. Claude Code is more likely to reason about what the output would be and skip the execution step. This is a genuine tradeoff: Codex catches runtime errors earlier, but at the cost of more tokens spent on execution output parsing.
Search. Claude Code uses codebase search (grep, glob) more aggressively to understand project structure. In a typical trace, you'll see 3-5 search calls in the planning phase. Codex tends to navigate by file path. It'll read src/index.ts, find an import, and follow it. This works well in well-structured projects but can miss relevant files in flatter directory structures.
Error recovery
This is where the traces got interesting. We deliberately included tasks with ambiguous requirements and tasks that would require at least one correction.
Claude Code's recovery pattern is typically: detect the error, re-read the relevant file, reason about what went wrong, then apply a targeted fix. The trace shows a distinct "diagnosis" phase, often 500 to 1,000 tokens of reasoning between the error and the fix attempt.
Codex's recovery pattern is more iterative: detect the error, try a fix, run again, try another fix if needed. The traces show shorter reasoning spans but more fix-test cycles. On average, Codex takes 1.8 attempts to resolve an error compared to Claude Code's 1.3, but Codex's attempts are faster individually.
The aggregate wall-clock time for error recovery is similar. But the approaches have different failure modes. Claude Code occasionally over-thinks a simple error, spending tokens reasoning about edge cases that don't apply. Codex occasionally under-thinks a complex error, applying surface-level fixes that don't address the root cause, leading to fix chains that compound.
Token economics
Here's the data most people actually want. Across all 30 tasks, 3 runs each:
Median tokens per task:
- Claude Code: 18,400 input + 4,200 output = 22,600 total
- Codex: 12,100 input + 5,800 output = 17,900 total
Claude Code uses more input tokens because it reads more context. Codex uses more output tokens because it writes more intermediate attempts. The total favors Codex by about 20%, but the cost difference is smaller than the token difference because input tokens are cheaper.
Median wall-clock time:
- Claude Code: 48 seconds
- Codex: 41 seconds
Codex is faster on average, driven primarily by its shorter planning phase. But the variance is higher. Codex's 90th percentile time is 94 seconds vs Claude Code's 78 seconds, because Codex's iterative approach occasionally spirals on complex tasks.
Task completion rate (defined as producing a correct solution within 3 minutes):
- Claude Code: 83%
- Codex: 79%
The gap widens on multi-file tasks (87% vs 74%) and narrows on single-file tasks (90% vs 91%).
What the traces actually tell you
The traces confirm what the vibes suggest but add nuance:
Claude Code is better when the task requires understanding context across multiple files. Its upfront planning and aggressive file reading pays off when the solution depends on understanding how pieces fit together. The traces show it making fewer incorrect assumptions about code it hasn't read.
Codex is better when the task is well-scoped and the iteration cycle is fast. Bug fixes with clear reproduction steps, single-file features, tasks where "try it and see" is a reasonable strategy. Its lower overhead means faster time-to-first-result on these tasks.
Neither is reliably better at the other's strength. This isn't a "one is strictly better" situation. It's a genuine architectural tradeoff between upfront reasoning and iterative execution.
The meta-lesson is that you can't evaluate coding agents by looking at their outputs. Two agents can produce identical final code through completely different processes, and the process matters because it determines how they'll handle the next task, and the one after that. Traces give you visibility into the process. Outputs alone don't.
How to trace your own agents
If you want to run this kind of comparison yourself, the setup is straightforward. Respan's SDK wraps any LLM call with OpenTelemetry spans, so you get full traces without modifying the agent's code. Point the OTEL exporter at your Respan project, run the agent, and the trace shows up in the dashboard with every LLM call, tool call, and token count broken out.
The traces in this post are from our public demo project. You can explore them directly in the Respan dashboard if you want to dig into the raw data.


