  1. Sign up — Create an account at platform.respan.ai
  2. Create an API key — Generate one on the API keys page
  3. Add credits or a provider key — Add credits on the Credits page or connect your own provider key on the Integrations page

What is Respan Tracing?

The Respan tracing SDK uses OpenTelemetry under the hood. Add the respan_tracing package to your project and annotate your workflows with @workflow and @task decorators to get full trace visibility.

Setup

1

Install the SDK

pip install respan-tracing
Python Requirement: This package requires Python 3.9 or later.
2

Set environment variables

RESPAN_BASE_URL="https://api.respan.ai/api"
RESPAN_API_KEY="YOUR_RESPAN_API_KEY"
3

Initialize and run a workflow

import os
from openai import OpenAI
from respan_tracing.decorators import workflow, task
from respan_tracing.main import RespanTelemetry

# Initialize Respan Telemetry
os.environ["RESPAN_API_KEY"] = "YOUR_RESPAN_API_KEY"
k_tl = RespanTelemetry()

# Initialize OpenAI client
client = OpenAI()

@task(name="joke_creation")
def create_joke():
    completion = client.chat.completions.create(
        model="gpt-4o-mini",
        messages=[{"role": "user", "content": "Tell me a joke about AI"}],
        temperature=0.7,
        max_tokens=100,
    )
    return completion.choices[0].message.content

@workflow(name="simple_joke_workflow")
def joke_workflow():
    joke = create_joke()
    return joke

if __name__ == "__main__":
    result = joke_workflow()
    print(result)
4

View your trace

Open the Traces page in the Respan dashboard.
Agent tracing visualization
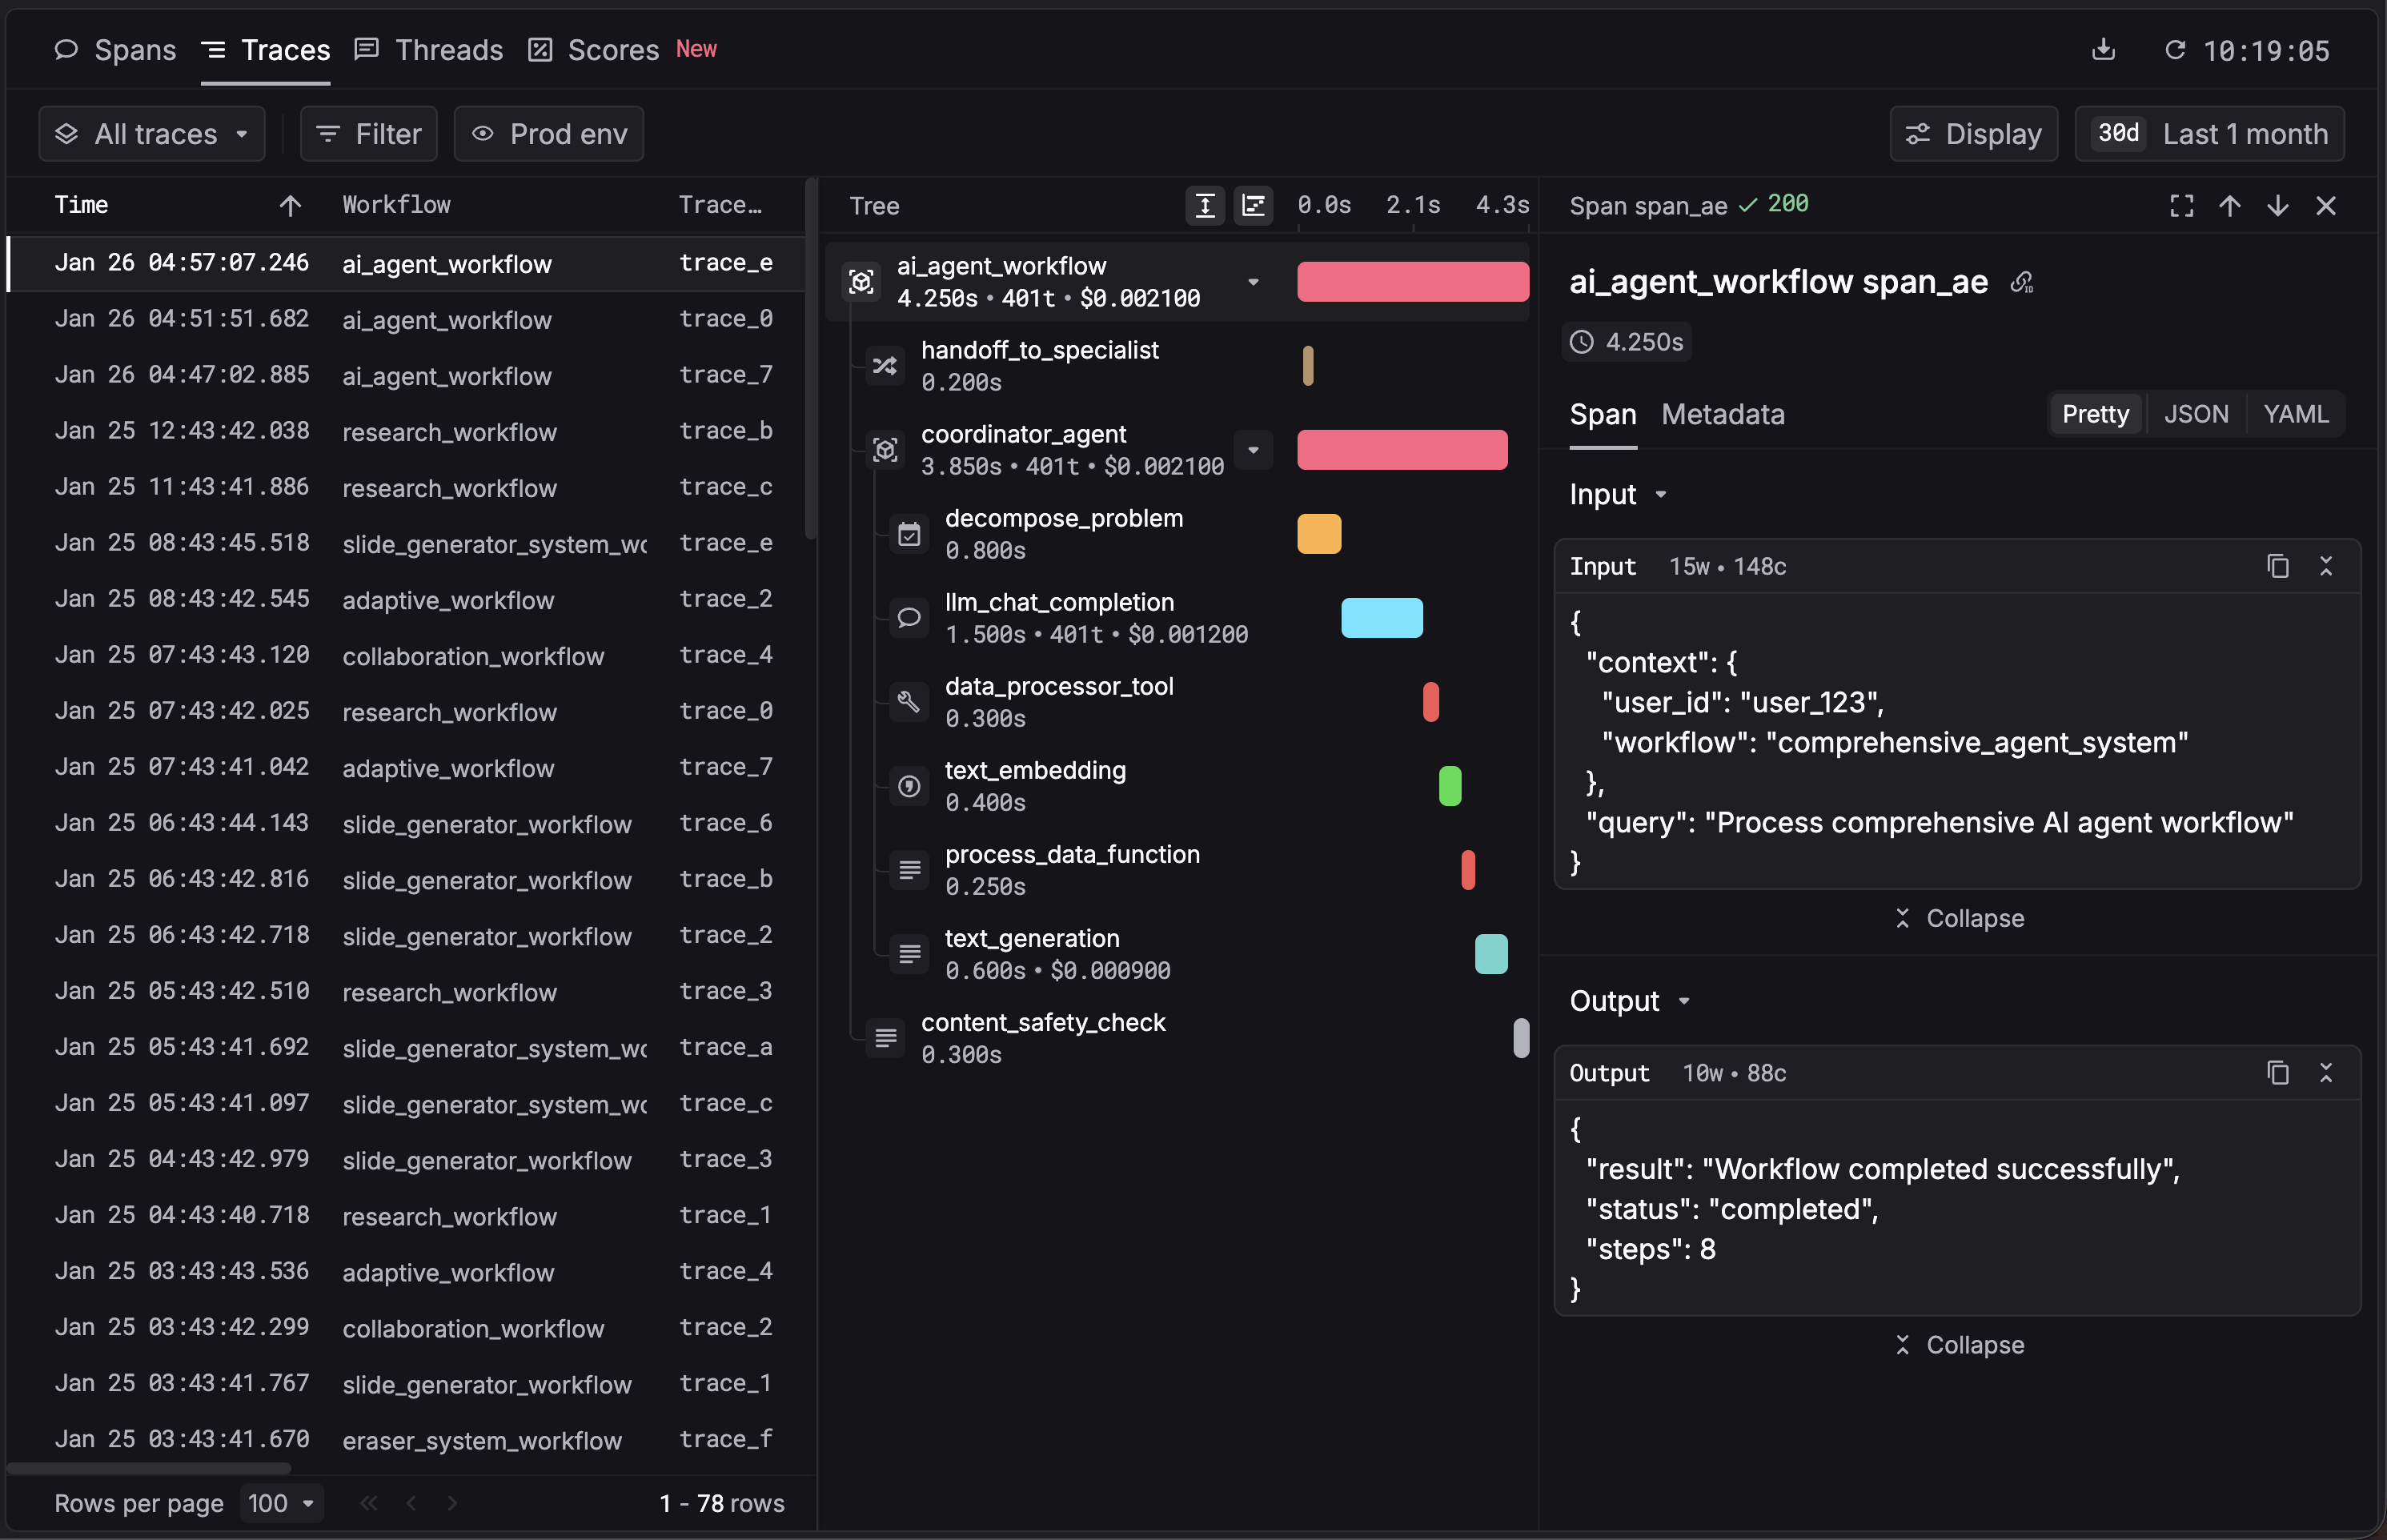
Optional HTTP instrumentation: if you see logs like Failed to initialize Requests instrumentation, install the OpenTelemetry instrumentations:
pip install opentelemetry-instrumentation-requests opentelemetry-instrumentation-urllib3
This is optional; tracing works without them. Add only if your app uses requests or urllib3.

Observability

With this integration, Respan auto-captures:
  • Workflows — each @workflow-decorated function as a root trace
  • Tasks — each @task-decorated function as a span
  • LLM calls — model, input/output messages, token usage
  • Performance metrics — latency per step
  • Errors — failed tasks and error details
View traces on the Traces page.