Nearly every vendor in the space now sells "observability," while plenty of teams still run what is, in practice, monitoring with a new label. The terms get used so loosely that engineers keep debating where one ends and the other begins, especially once a system grows past a handful of services.
The distinction matters because it decides what you can answer when something breaks. Monitoring covers the failures you predicted, and observability covers the ones you didn't, and as systems spread across microservices, queues, and LLM calls, more failures fall into the second group.
The two work best as layers rather than alternatives. Monitoring tells you when to look, and observability gives you something to look at.
Here's observability vs monitoring broken down by where the two overlap and where they differ.
TL;DR: Observability vs Monitoring
The short version:
- Monitoring - Tracks predefined metrics and alerts when one crosses a threshold. It answers whether something is wrong.
- Observability - Lets you investigate a system's internal state from the telemetry it emits, including failures nobody predicted. It answers why.
- Where they overlap - Both run on the same telemetry (metrics, events, logs, and traces) and share the goal of a reliable system.
- Which you need - Both. Monitoring detects the problem, and observability diagnoses it.
For LLM apps and AI agents, the gap between the two gets wider, since a common failure there is a wrong answer delivered successfully, which no threshold catches.
What Is Monitoring?
Monitoring is the practice of collecting predefined metrics over time and alerting when they cross a threshold. You decide up front what to watch, such as request rate, error rate, latency, CPU, or cost, and the system tells you when a number moves out of range.
It answers one question: is something wrong right now? A monitor on error rate pages you when it climbs from 5% to 7%, and a latency monitor fires when p95 response time doubles. Monitoring is cheap to run and reliable for the failures you already know how to name.
Its limit is built into its design, since monitoring only reports on the signals you thought to track. Deciding what to watch is its own discipline, and it shifts with the workload: for AI apps, LLM monitoring adds token cost and response quality to the usual list, while synthetic monitoring tools generate test traffic so a monitor can fire before a real user hits the problem.
What Is Observability?
Observability is the ability to understand a system's internal state from the data it emits, without shipping new code to ask a new question. Where monitoring watches known metrics, observability lets you investigate what happened after the fact, including failures you never anticipated.
The difference shows up during an investigation. A monitored system tells you the error rate rose. An observable system lets you open the failing requests, follow each one through every service it touched, and read the inputs, outputs, and decisions at each hop.
That property matters most in systems with many moving parts, such as microservices, distributed queues, and anything that calls an LLM, because the failure modes there are hard to predict in advance.
What's the Difference Between Observability and Monitoring?
The core difference is that monitoring tells you something is wrong, and observability tells you why. Monitoring is a fixed set of metrics with alerts attached. Observability is the ability to ask new questions of your telemetry once something breaks, including questions nobody thought to set an alert for.
| Monitoring | Observability | |
|---|---|---|
| Question it answers | Is something wrong? | Why is it wrong? |
| Data | Predefined metrics and thresholds | Metrics, events, logs, and traces together |
| Failure modes | Known, named in advance | Unknown, found after the fact |
| Output | Alerts and dashboards | Explorable request-level detail |
| Where it helps | Detecting an incident | Diagnosing an incident |
In practice, that makes monitoring bound to the questions you registered in advance and observability open to the ones you didn't. A team with good monitoring knows within minutes that checkout latency doubled, and a team with good observability can tell which downstream call caused it.
What Are the Similarities Between Observability and Monitoring?
Monitoring and observability overlap more than the comparison suggests. They run on the same telemetry, since the metrics a monitor watches are aggregated from the same events, logs, and traces an investigation reads. They also share the goal of keeping a system reliable and shortening the time between a failure and a fix, and neither works on a service that emits nothing, so instrumentation is a prerequisite for both.
The overlap is also why the two get confused. Observability platforms usually include monitoring, so monitors, dashboards, and alerts tend to live in the same tool as the traces you investigate with. The practical question then becomes whether that tool lets you move from an alert to the data behind it.
Which Is Better: Observability or Monitoring?
Neither is better on its own, because they do different jobs in sequence. Monitoring is your early warning and observability is your investigation, so one tells you to look and the other tells you where:
- Lead with monitoring - Put thresholds on the metrics that map to user pain: error rate, p95 latency, and cost per request or per user. These catch the failures that announce themselves.
- Add observability underneath - When a monitor fires, or a user reports a failure no monitor caught, trace the request end to end instead of guessing which step broke.
Treating them as a choice causes trouble in both directions. Monitoring without observability leaves you with healthy-looking dashboards and no way to explain a failure they missed, and observability without monitoring leaves you with rich data and nothing telling you when to look.
The Pillars of Observability
Most definitions of observability rest on three pillars: logs, metrics, and traces. Logs are timestamped records of discrete events, metrics are those events aggregated into numbers over time (the part monitoring watches), and traces follow a single request across every service and step it touches.
Some frameworks add events as a fourth pillar, often abbreviated MELT for metrics, events, logs, and traces. Events capture state changes like a deploy or a config change, which is often the context that explains why a metric moved. Whichever count you use, the pillars matter less on their own than whether you can correlate them, since a metric spike you can't connect to the traces behind it only tells you half the story.
Observability vs Monitoring for LLM Apps and AI Agents
LLM apps widen the gap between the two, because a request can return a 200, cost the usual amount, run at normal latency, and still be wrong. Take an agent that files expense reports. It reads a receipt image, extracts the vendor and amount, calls a policy lookup to check whether the category is reimbursable, then writes the entry.
When finance reports that a $400 client dinner was filed under office supplies, the two approaches diverge:
- Monitoring - Every metric is green. The request succeeded at the usual cost and latency, and nothing about a wrong category crosses a threshold.
- Observability - You open the run and walk the steps. Extraction read the vendor correctly, but the policy lookup returned a stale category mapping from a cached response, and the model filed the entry around that stale value. The bug lived in the tool call, and the trace shows it in seconds.
That pattern is why AI observability adds full agent-run traces and evals on output quality to the classic pillars, and why LLM observability goes down to the individual model call: the prompt, the completion, and the tokens behind it. Agent debugging without step-level traces turns into guesswork, and the more steps an agent has, the worse that guessing gets.
Running Monitoring and Observability on the Same Data
A common way for this to break down is the gap between the two disciplines: monitors in one tool, traces in another, cost in a billing export. When a monitor fires, nobody can open the requests behind it without rebuilding the query somewhere else.
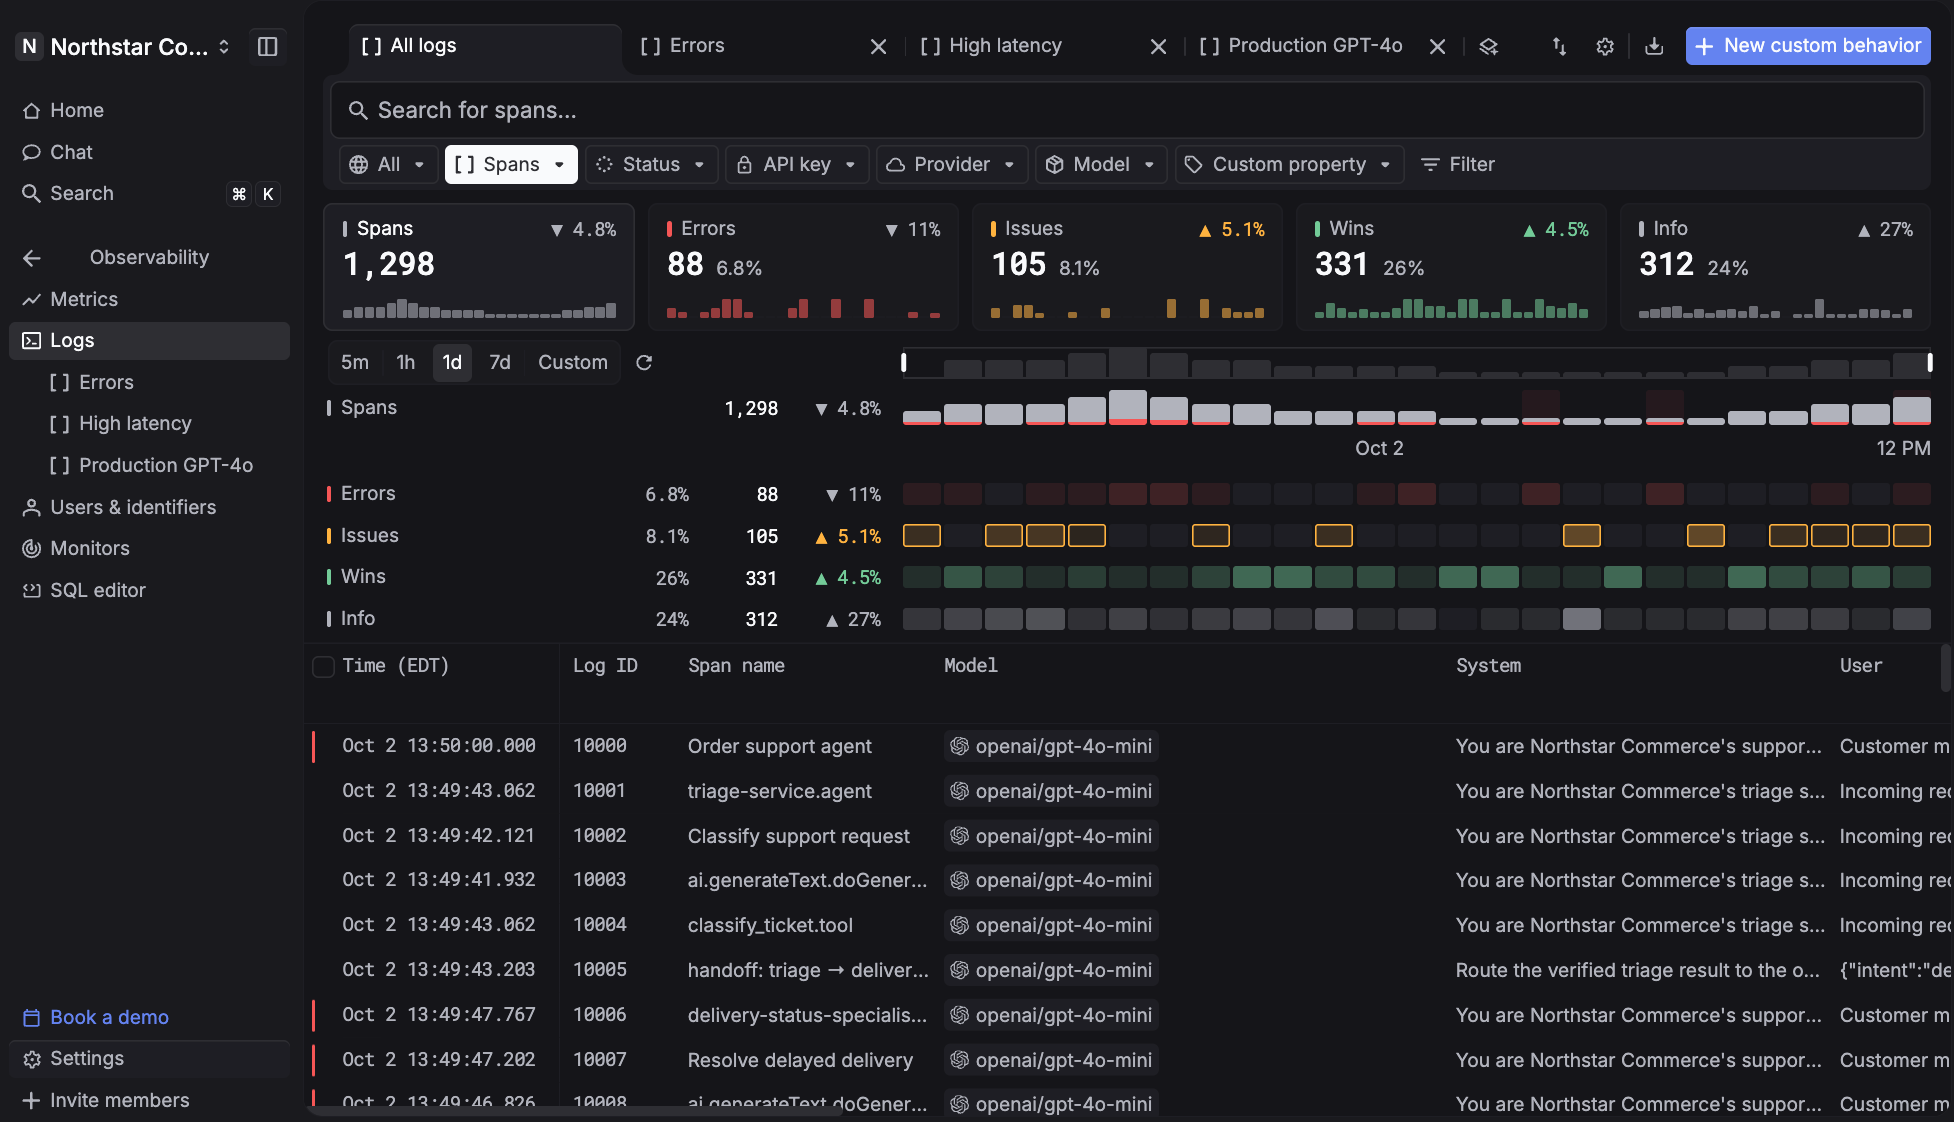
Respan is built to route, observe, and evaluate every LLM call on one platform, so the monitors and the traces run on the same data. Instead of reading logs after the fact, use Respan to run observability in production, know when production shifts, and act before it spreads.
- Monitors on the metrics that matter - Watch request count, errors, tokens, cost, or latency over a rolling window, filtered by API key, model, provider, customer, or prompt, and get alerted in Slack, Microsoft Teams, email, or a webhook on breach.
- Alerts with context - Each alert carries the value that crossed, the window totals, and the top users, API keys, and models behind it, and from the monitor you can open the spans behind each run.
- Breakdowns that narrow a regression - Slice requests, tokens, errors, latency, and cost by model, user, and API key to find the feature behind a spike before it spreads.
- Quality alongside uptime - Evaluations, including LLM-as-judge, score the wrong-but-successful outputs no status code will flag.
- Compliance built in - SOC 2, ISO 27001, GDPR, and HIPAA with a BAA, plus PII masking for apps that touch regulated data.
When the monitors, traces, and scores sit on the same data, a regression reaches you before it reaches a customer, and the investigation starts from the spans that caused it.
Frequently Asked Questions
What Are the Top Observability Tools?
It depends on what you run. For infrastructure and microservices, general observability platforms built around APM, logs, and metrics are the standard choice. For LLM apps and AI agents, you need a tool that traces full agent runs and scores output quality, and general platforms vary widely in how far they go on that. Respan covers that side, with routing, tracing, monitors, and evals on one platform. The wider field of AI observability tools spans both groups, from APM vendors that added AI features to platforms built for LLM workloads.
What's the Difference Between Observability, Monitoring, and Telemetry?
Telemetry is the raw data a system emits: the metrics, events, logs, and traces that instrumentation, often OpenTelemetry, collects and exports. Monitoring and observability are two ways of using it. Monitoring watches a predefined slice of that telemetry and alerts when a value crosses a threshold, while observability is the ability to explore all of it to explain behavior you didn't anticipate. Without good telemetry, neither one works, which is why instrumentation is usually the first decision rather than the tool.